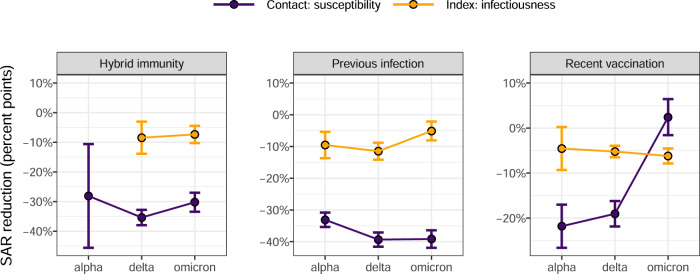
Fig. 2. Immunity, susceptibility to be infected and infectiousness.
Effect of immunity (recent vaccination, recent infection or hybrid immunity) on the susceptibility to be infected (magenta) or on the infectiousness (yellow), expressed as the estimated percent point change of secondary attack rate (circle) and its 95% confidence interval (error bars), stratified per period of variant predominance. Estimates and confidence intervals are produced by a generalized estimating equations linear regression with robust standard errors predicting a binary outcome indicating if the contact was infected by the index or not, using the index cases as cluster and an exchangeable correlation structure. Estimates are adjusted for the index case gender, age, obesity, presence of symptoms, presence of cough, immunity status, neighbourhood socioeconomic condition, vulnerability and type of living; the link between the index case and its contacts, and for the contact persons, their gender, age, number of tests performed the three months before the contact date with the index case, their immunity status, and an interaction between immunity status and number of tests performed. The reference index case–contact relation of this multivariate analysis is the contact between two men of age below 65 living at the same place, the index being not vaccinated not infected (NVNI), not obese, living in a wealthy neighbourhood and being not a vulnerable person, living in a housing building, and the contact person being a NVNI adult men who performed one SARS-CoV-2 test during the last 3 month preceding the contact. Same results are presented graphically in Fig. 1.

