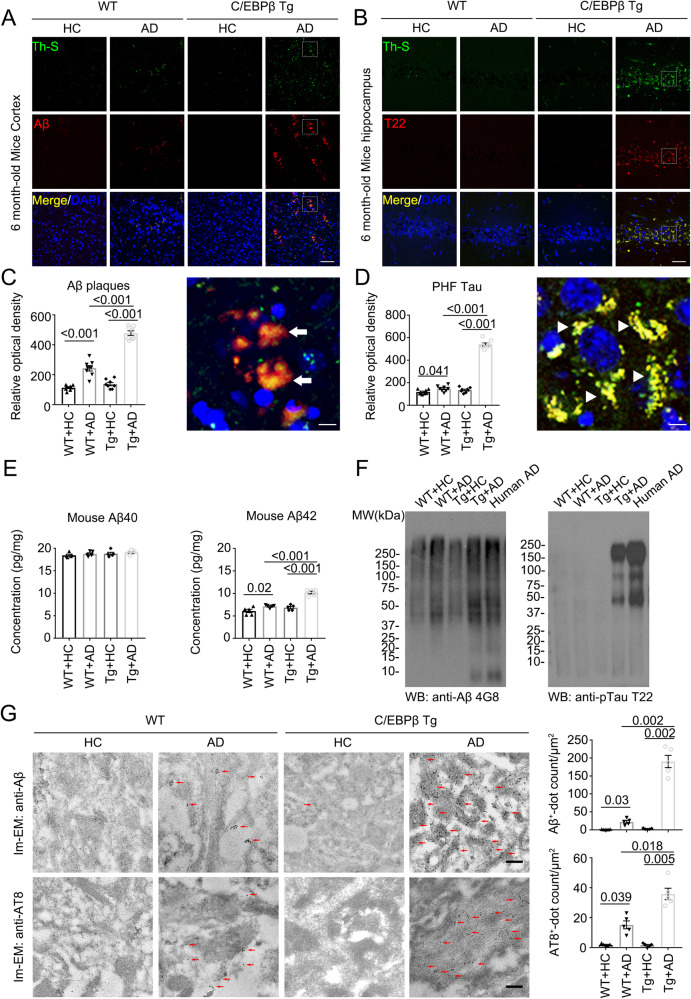
Fig. 1. AD humanized Abx-treated mice display increased AD pathologies compared with HC humanized Abx-treated mice in WT and C/EBPβ Tg mice.
A, B Immunofluorescent staining of Aβ (red) and Th-S (green) in the frontal cortex region of brains, Th-S (green) and T22 (red) in the hippocampus CA1 region of brains from 6-month-old AD humanized Abx-treated mice and HC humanized Abx-treated mice. Scale bar: 40 μm. C Quantitative analysis of Aβ and Th-S positive plaques (left panel, n = 8 biologically independent samples in each group, data are shown as mean ± SEM. one-way ANOVA and Bonferroni’s multiple comparison test). A high magnification picture showed Aβ plaques (Arrow) were significantly increased in AD humanized Abx-treated mice brain (right panel, Scale bar: 10 μm). D Quantitative analysis of T22 and Th-S positive PHFs (left panel, n = 8 biologically independent samples in each group, data are shown as mean ± SEM. one-way ANOVA and Bonferroni’s multiple comparison test). A high magnification picture showed PHF Tau (Arrowhead) were significantly increased in AD humanized Abx-treated mice brain (right panel, Scale bar: 10 μm). E Aβ40 and Aβ42 concentrations in the cortex of AD or HC humanized Abx-treated mice were measured using mouse Aβ40 and Aβ42 ELISA kit. the concentration of Aβ42, not Aβ40 was significantly increased in AD humanized Abx-treated mice compared with HC humanized Abx-treated mice cortex. (n = 5 biologically independent samples in each group, data are shown as mean ± SEM, one-way ANOVA and Bonferroni’s multiple comparison test). F Enrichment of aggregated Tau and Aβ in the detergent-insoluble fractions of mouse brains and AD human cortex. Sarkosyl-insoluble fractions were blotted with antibodies against Aβ (4G8), or Tau T22 for Tau oligomers (representative of 3 mice). G immunogold EM showed the aggregated extracellular Aβ and intracellular AT8 in the hippocampus neurons of AD or HC humanized Abx-treated mice. Fibrils like structures (arrows) were highly increased in AD humanized Abx-treated mice (left panels, Scale bar: 200 nm). Quantitative analysis of Aβ and AT8 positive dots. (Right panel, n = 5 biologically independent samples in each group, data are shown as mean ± SEM, one-way ANOVA and Bonferroni’s multiple comparison test).

