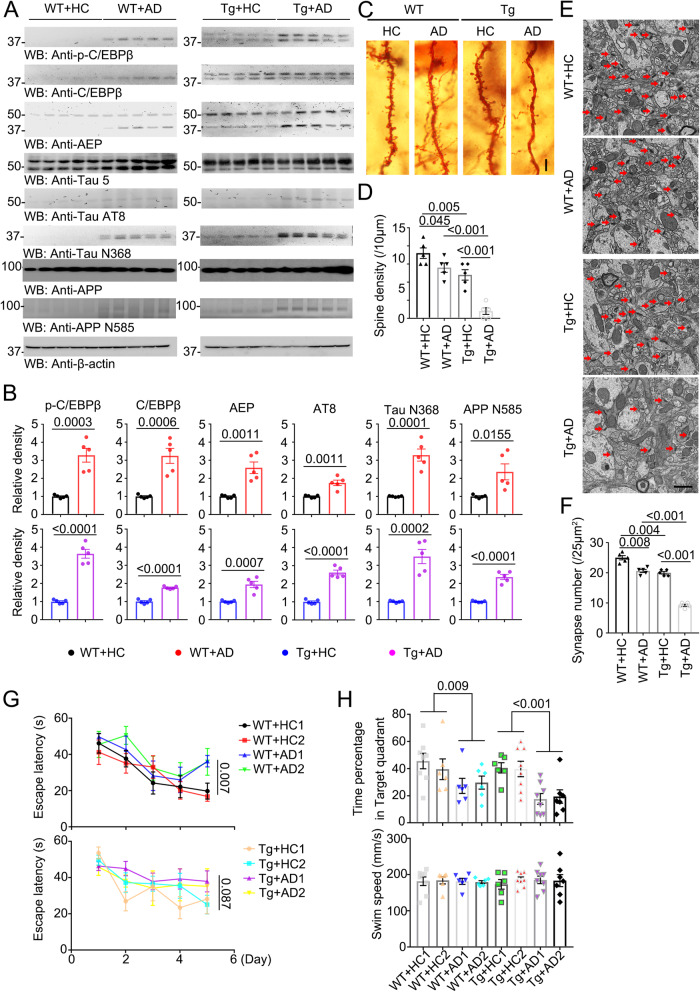
Fig. 2. AD humanized Abx-treated mice display increased toxic proteins and declining cognitive functions compared with HC humanized Abx-treated mice in WT and C/EBPβ Tg mice.
A Immunoblot showing p-C/EBPβ, C/EBPβ, AEP, APP and tau expression and processing in 6-month-old mouse brains of AD or HC humanized Abx-treated mice. B Quantitative analysis of immunoblot. The bands of p-C/EBPβ, C/EBPβ, AEP, AT8, TauN368, and APPN585 were measured with image J and normalized with β-actin. (n = 5 biologically independent samples in each group, data are shown as mean ± SEM, two-tailed Student’s t test). C The dendritic spines from the apical dendritic layer of the hippocampus CA1 region were analyzed by Golgi staining. Scale bar: 10 μm. D Quantitative analysis of Golgi staining, (n = 5 biologically independent samples in each group, data are shown as mean ± SEM, one-way ANOVA and Bonferroni’s multiple comparison test). E Electron microscopy analysis of synapses, the number of synapses in CA1 region of AD humanized Abx-treated mice were decreased compared with HC humanized Abx-treated mice. Arrows indicate the synapses. Scale bar, 1 μm. F Quantitative analysis of synapses in CA1, (n = 5 biologically independent samples mice per group, mean ± SEM. one-way ANOVA and Bonferroni’s multiple comparison test). (G & H) Morris Water Maze analysis of cognitive functions. AD humanized Abx-treated mice exacerbated the learning and memory dysfunctions, but does not affect motor function. (mean ± SEM., one-way ANOVA and Bonferroni’s multiple comparison test). WT + HC1 (n = 8 biologically independent samples); WT + HC2 (n = 6 biologically independent samples); WT + AD1 (n = 6 biologically independent samples); WT + AD2 (n = 6 biologically independent samples); Tg+HC1 (n = 6 biologically independent samples); Tg +HC2 (n = 8 biologically independent samples); Tg +AD1 (n = 8 biologically independent samples); Tg +AD2 (n = 7 biologically independent samples).

