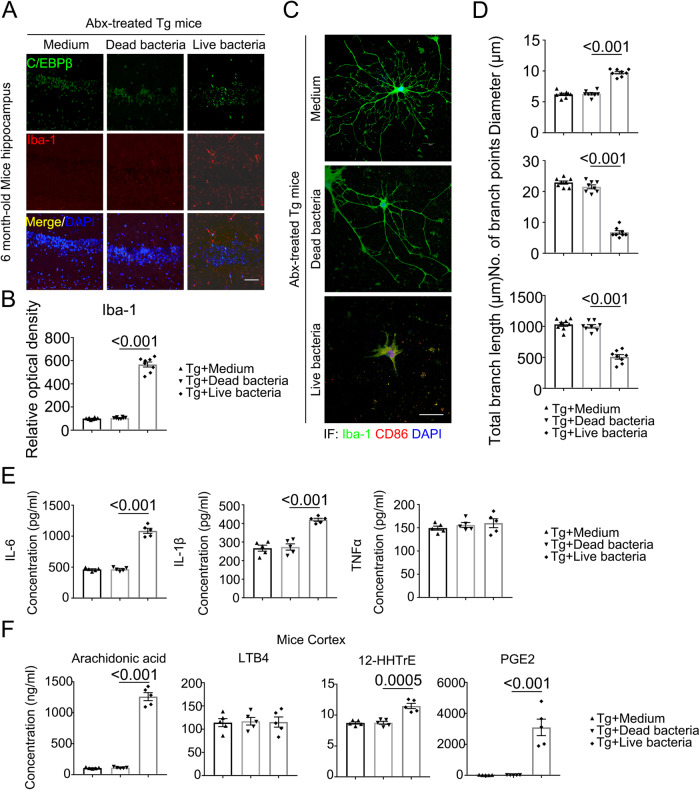
Fig. 5. Live bacteria treated mice display increased activated microglia and inflammatory cytokines compared with control mice in C/EBPβ Tg mice.
A Immunofluorescent staining of Iba-1 (red) and C/EBPβ (green) in the hippocampus CA1 region of the brains from 6-month-old Abx-treated C/EBPβ Tg mice after medium, dead bacteria, or live bacteria (Bacteroides fragilis) gavage for 2 months. Scale bar: 40 μm. B Quantitative analysis of Iba-1 optical density (n = 8 biologically independent samples in each group, data are shown as mean ± SEM, one-way ANOVA and Bonferroni’s multiple comparison test). C The high magnification of immunofluorescent staining of Iba-1 (green) and CD86 (red) positive microglia in the hippocampus CA1 region of the brains from Abx-treated C/EBPβ Tg mice after medium, dead bacteria, or live bacteria (Bacteroides fragilis) gavage for 2 months. Scale bar: 40 μm. D Quantitative analysis of diameter, number of branch points, and total branch length in Iba-1 (green) positive microglia. (n = 8 biologically independent samples in each group, data are shown as mean ± SEM, one-way ANOVA and Bonferroni’s multiple comparison test). E proinflammatory cytokine IL-1β, IL- 6 and TNFα concentrations in the brain lysates from Abx-treated C/EBPβ Tg mice after medium, dead bacteria, or live bacteria (Bacteroides fragilis) gavage for 2 months, respectively. (n = 5 biologically independent samples in each group, data are shown as mean ± SEM, one-way ANOVA and Bonferroni’s multiple comparison test). F Concentrations of arachidonic acid (AA) and its metabolites in Abx-treated C/EBPβ Tg mice after medium, dead bacteria, or live bacteria (Bacteroides fragilis) gavage cortex. (n = 5 biologically independent samples in each group, data are shown as mean ± SEM, one-way ANOVA and Bonferroni’s multiple comparison test).

