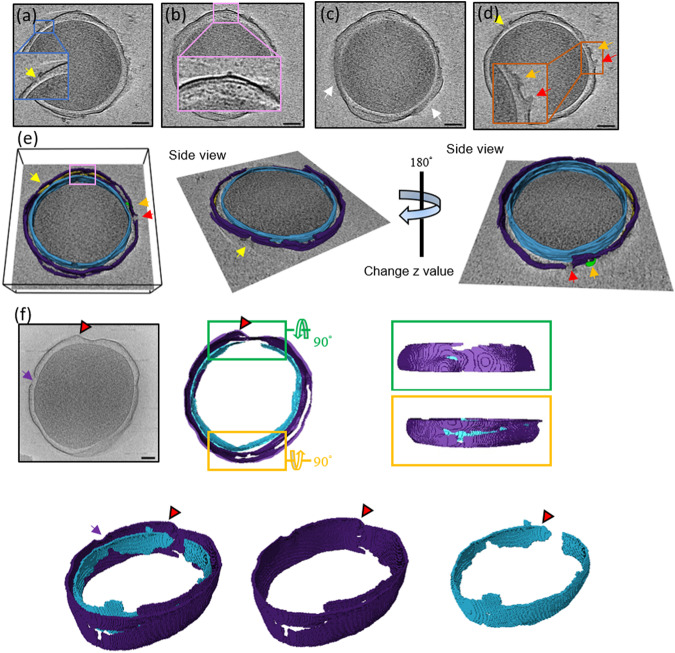
Fig. 3. Cryo-ET slices of two minicells treated with pepD2M and their inner and outer membranes.
a–d The cryo-tomographic slices of the minicell in Fig. 2g at different z-axis values. The insets present the zoomed-in images from the indicated boxes. Pores are pointed by arrows with different colors. Two volcanic-crater-like pores are indicated by the red and orange arrows. e 3D tomogram of the minicell in (a–d). f A cryo-tomographic slice (left) and its corresponding segmentations (right) of another minicell after the peptide treatment. A large pore with a diameter of 45 nm is indicated by a purple arrow. IM: cyan; OM: violet; PG: yellow; released material: green. Scale bar = 100 nm.

