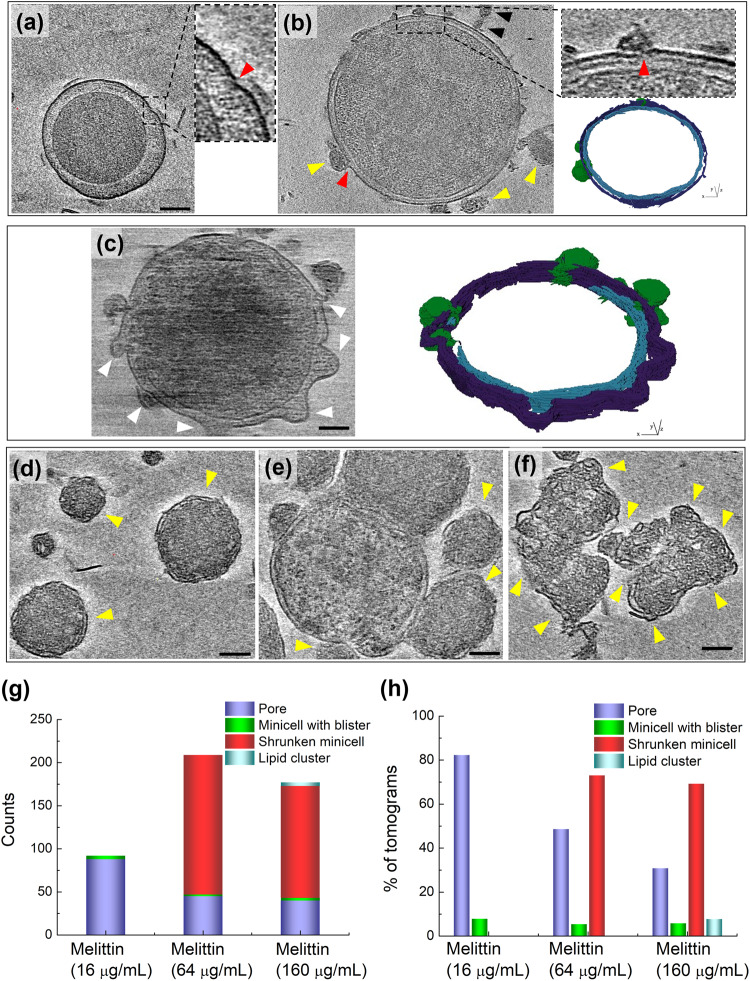
Fig. 5. Cryo-ET results of minicells treated with melittin.
a‒f The cryo-tomographic slices and the 3D segmentation of the minicells. IM: cyan; OM: violet; released material: green. Insets in (a) and (b): enlarged images of the membrane with a pore. The red arrowhead indicates the location of the pore. Lipid clusters are indicated by black arrowheads. The location of blisters and shrunken minicells are indicated by white and yellow arrowheads, respectively. Scale bar = 100 nm. g Counts of pores, minicells with blisters, shrunken minicells, and lipid clusters after the treatment with different concentrations of melittin. h The proportion of the occurrence of pores, minicells with blisters, shrunken minicells, and lipid clusters in 140 tomograms.

