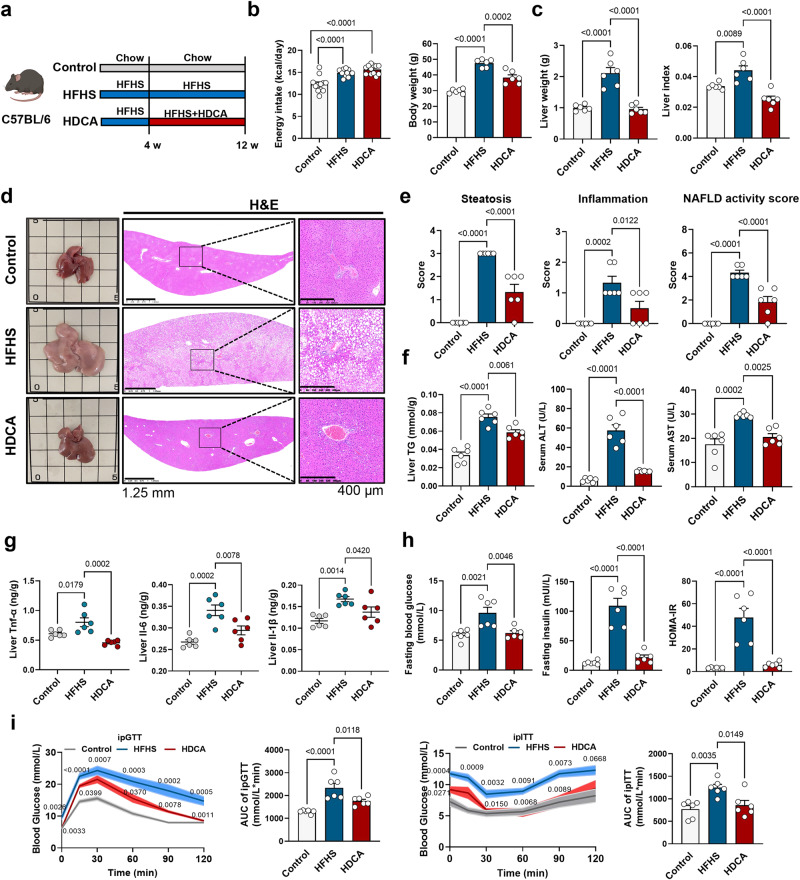
Fig. 2. HDCA supplementation ameliorates NAFLD in mice.
The C57BL/6 mice in control group and HFHS group were fed with chow or HFHS diet for 12 weeks. HDCA group were fed with HFHS for 4 weeks and then supplemented with 0.625% HDCA in the HFHS diet for another 8 weeks. a Schematic representation of HDCA intervention in HFHS-fed C57BL/6 mice (n = 6 per group). Mouse element created with BioRender.com. b Energy intake (energy intake was recorded every week for 12 weeks, n = 12 per group) and body weight (n = 6 per group). c Liver weight and liver index. d Representative images of liver general appearance, H&E staining (Scale bar, 1.25 mm and 400 μm). e Steatosis score, inflammation score, and NAFLD activity score. f Liver TG, serum ALT and AST level. g Levels of TNF-α, IL-6, and IL-1β in the liver. h Fasting blood glucose, fasting insulin, and HOMA-IR. i Intraperitoneal glucose tolerance test (ipGTT) and intraperitoneal insulin tolerance test (ipITT) results with area under the curve (AUC) calculation. c–i n = 6 per group. Data are presented as mean values ± SEM. Difference between groups were determined by one-way ANOVA test followed by Tukey’s multiple comparison. i p values around the blue line represent comparison with control group, the p values around the red line represent comparison with HFHS group. Source data are provided as a Source Data file.

