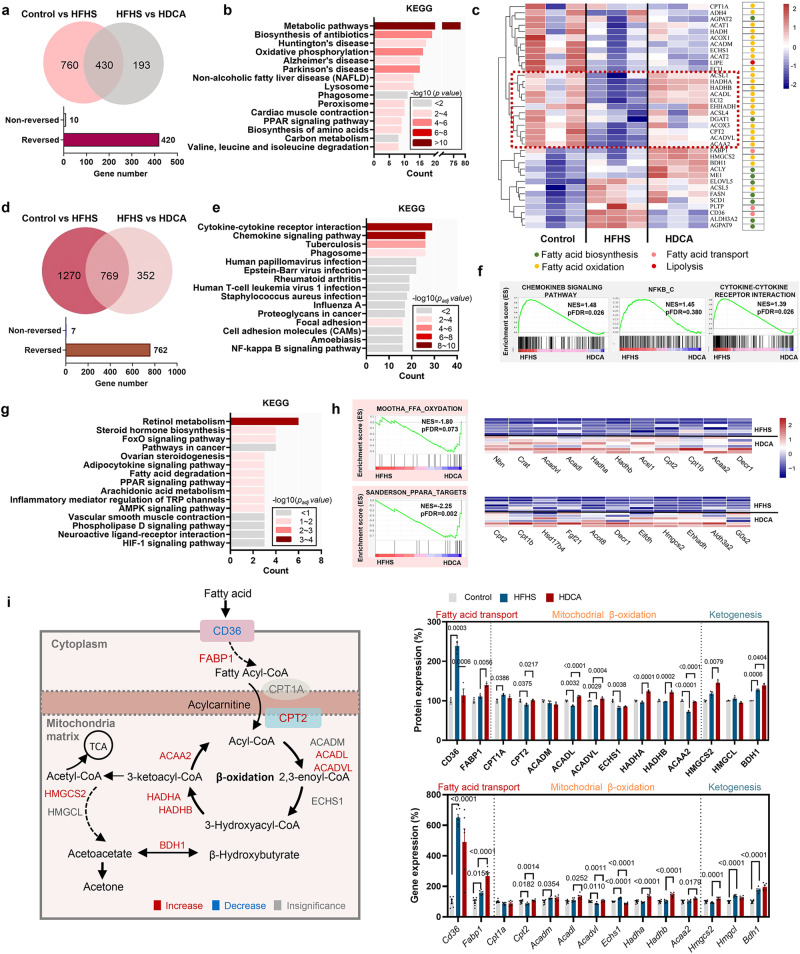
Fig. 3. HDCA activates fatty acid oxidation in hepatocytes.
a Venn diagram of significantly regulated proteins by HFHS or by HDCA as shown by proteomics. b Top 15 pathways enriched with KEGG enrichment analysis based on the 420 reserved proteins (n = 3 per group). c Heatmap of proteins related to fatty acid metabolism. d Venn diagram of significantly regulated genes by HFHS or by HDCA as shown by transcriptomics (n = 6 per group). e Top 15 pathways with KEGG enrichment analysis based on the genes that are upregulated by HFHS and downregulated by HDCA and (f) GSEA analysis of chemokine signaling pathway, NFκB, and cytokine-cytokine receptor interaction. g Top 15 pathways with KEGG enrichment analysis based on the genes that are downregulated by HFHS and upregulated by HDCA and h GSEA analysis of fatty acid oxidation and PPARα targets. i Schematic diagram of fatty acid transport, β-oxidation, and ketogenesis in the mitochondria, and the expression changes of related proteins and genes in this process (Red and blue represent upregulation and downregulation of proteins and genes in HDCA group compared with HFHS group, respectively. Gray represents no significate difference between two groups) (n = 3 per group). Data are presented as mean values ± SEM. Difference between groups were determined by one-way ANOVA test followed by Tukey’s multiple comparison. The average of gene and protein expression in control group is normalized as 100%. Source data are provided as a Source Data file.

