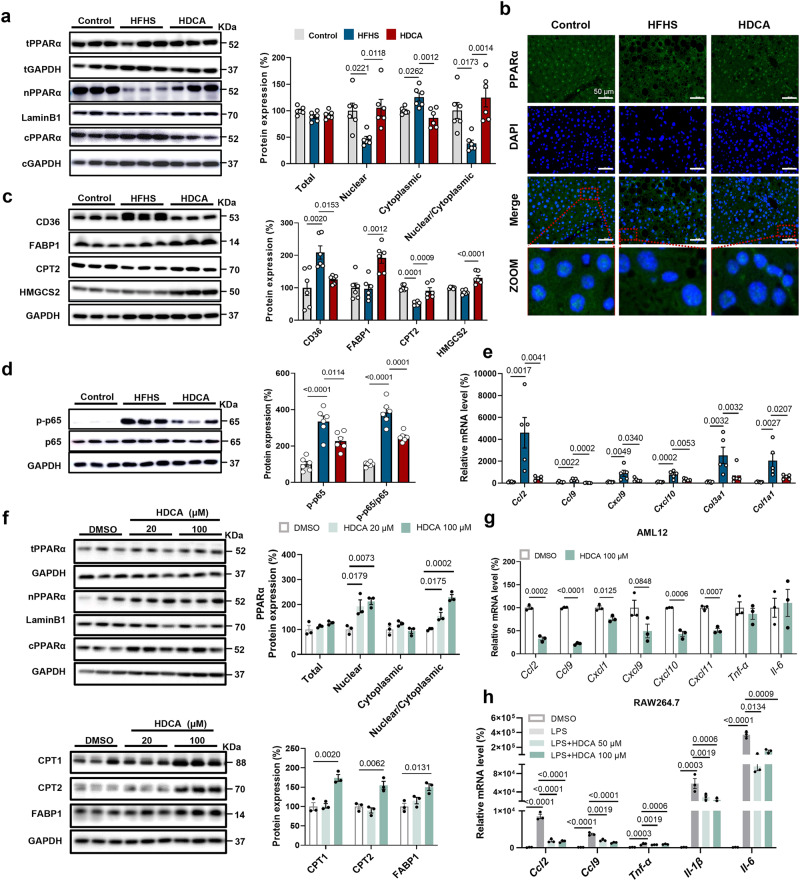
Fig. 4. HDCA stimulates nuclear accumulation of PPARα and promotes the expression of PPARα target gene.
a–e Liver samples are from the HFHS-fed C57BL/6 mice with 0.625% HDCA intervention as in Fig. 2a. a HDCA intervention promoted the nuclear accumulation of PPARα (n = 6 per group). b Immunofluorescence staining of liver PPARα, Scale bar, 50 μm. The immunofluorescence analyses were representative of data from three mice. c, d Protein expressions of CD36, FABP1, CPT2, HMGCS2, p-p65, p65, IKBα in the liver (n = 6 per group). e mRNA expressions of liver Ccl2, Ccl9, Cxcl9, Cxcl10, Col3a1, Col1a1 (n = 6 for Control, n = 5 for HFHS and HDCA). f Protein expressions of PPARα at 24 h, and protein expressions of CPT1, CPT2, FABP1 at 48 h in AML12 cells treated with or without 20 μM and 100 μM HDCA (n = 3 per group). g mRNA expressions of inflammation-related genes in AML12 cells after 100 μM HDCA treatment for 24 h (n = 3 per group). Difference between groups were determined by two-tailed Student’s t test. h mRNA expressions of Ccl2, Ccl9, Tnf-α, Il-1β, Il-6 in RAW264.7 macrophages (n = 3 per group). The RAW264.7 cells were treated with HDCA (50, 100 μM) for 24 h, in the last 6 hours of this experiment, LPS (20 ng/ml) was added into the medium. Except (g), difference between groups determined by one-way ANOVA test followed by Tukey’s multiple comparison. The findings in f–h were confirmed in three independent experiments. Data are presented as mean values ± SEM. The average of gene and protein expression in control group is normalized as 100%. Source data are provided as a Source Data file.

