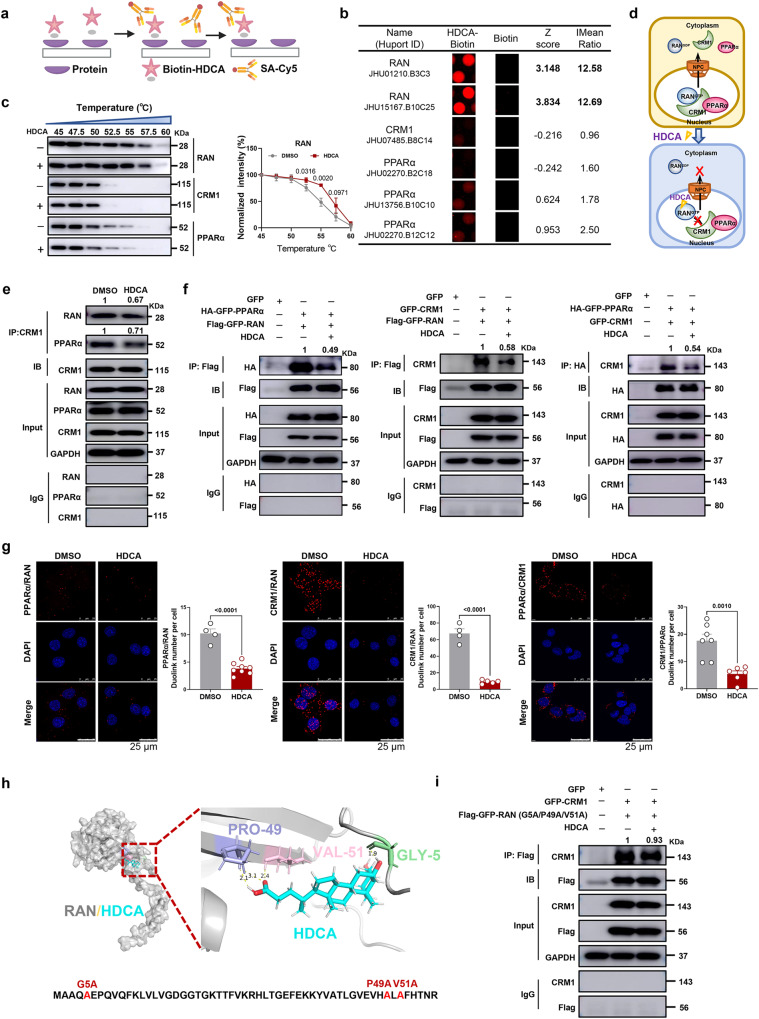
Fig. 7. HDCA directly binds with RAN to inhibit the formation of RAN/CRM1/PPARα export heterotrimer.
a Schematic showing steps for identifying HDCA-binding proteins using microarrays fabricated with recombinant human proteins. Created with BioRender.com. b Magnified image of Bio-HDCA binding to RAN, CRM1, PPARα spots on the protein array. Z score and I mean ratio are shown. c Representative western blots showing thermostable individual proteins following indicated heat shocks in the presence (+) or absence (−) of HDCA (100 μM) by CETSA. Quantification of thermostable RAN from CETSA (n = 3 biologically independent experiments). d Schematic showing interaction of HDCA with RAN/CRM1/PPARα export complex. e Co-IP assay of the association of CRM1/RAN and CRM1/PPARα in the presence of 100 μM HDCA in AML12 cells. f Co-IP assay of the association of Flag-GFP-RAN and HA-GFP-PPARα, Flag-GFP-RAN and GFP-CRM1, HA-GFP-PPARα and GFP-CRM1 in the presence of 100 μM HDCA in HEK293T cells. g Representative PLA images and duolink spot quantitation of PPARα/RAN, CRM1/RAN and PPARα/CRM1 interactions in AML12 cells (Scale bar, 25 μm). Representative images are shown for each condition from one of 3 biologically independent experiments. The graph shows the average number of PLA signals per cell, n = 4–8 random fields of view (42–60 cells of each condition). h Molecular docking between HDCA and RAN (RAN protein (gray), HDCA (blue), GLY-5 (green), PRO-49 (purple) and VAL-51 (pink)). i Co-IP assay of the association of Flag-GFP-RAN (G5A/P49A/V51A) and GFP-CRM1 in the presence of 100 μM HDCA (Gly-5, Pro-49, Val-51 of RAN were all mutated to Ala). Experiments in e, f, and i were repeated independently at least twice with similar results. Data are presented as mean values ± SEM. Differences between groups were determined by unpaired two-tailed Student’s t test. Source data are provided as a Source Data file.

