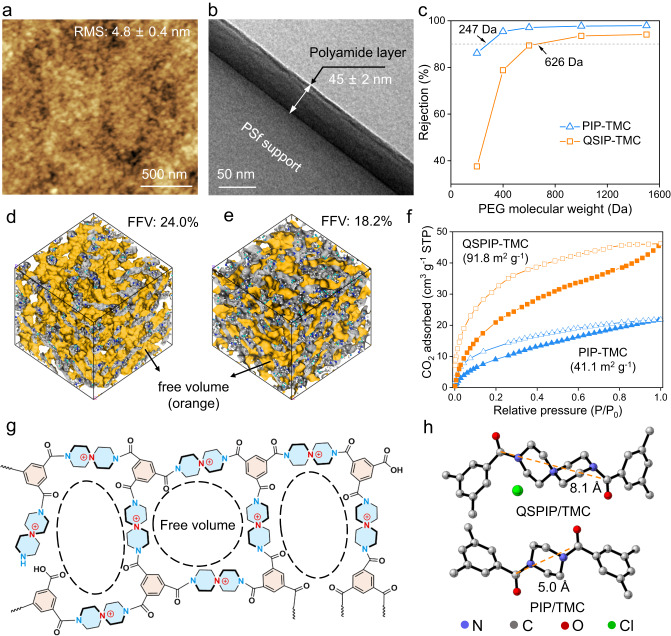
Fig. 2. Characterizations of QSPIP-TMC membranes.
a AFM surface morphology and b TEM cross-sectional morphology of the QSPIP-TMC membrane. The dark region is QSPIP-TMC due to the density contrast. c Rejections of QSPIP-TMC and PIP-TMC membranes toward polyethylene glycol with different molecular weight. d, e Molecular dynamics simulation of free volume of QSPIP-TMC and PIP-TMC networks, respectively. The orange and gray color indicate the voids of polymer and occupied space of polymer skeleton. f CO2 absorption/desorption isothermals of QSPIP-TMC and PIP-TMC. g Schematic structures of the QSPIP-TMC network. h The 3D structure of QSPIP-TMC and PIP-TMC linkage.

