
Fig. 3. Spatial heterogeneity patterns of the observed data and the model predictions.
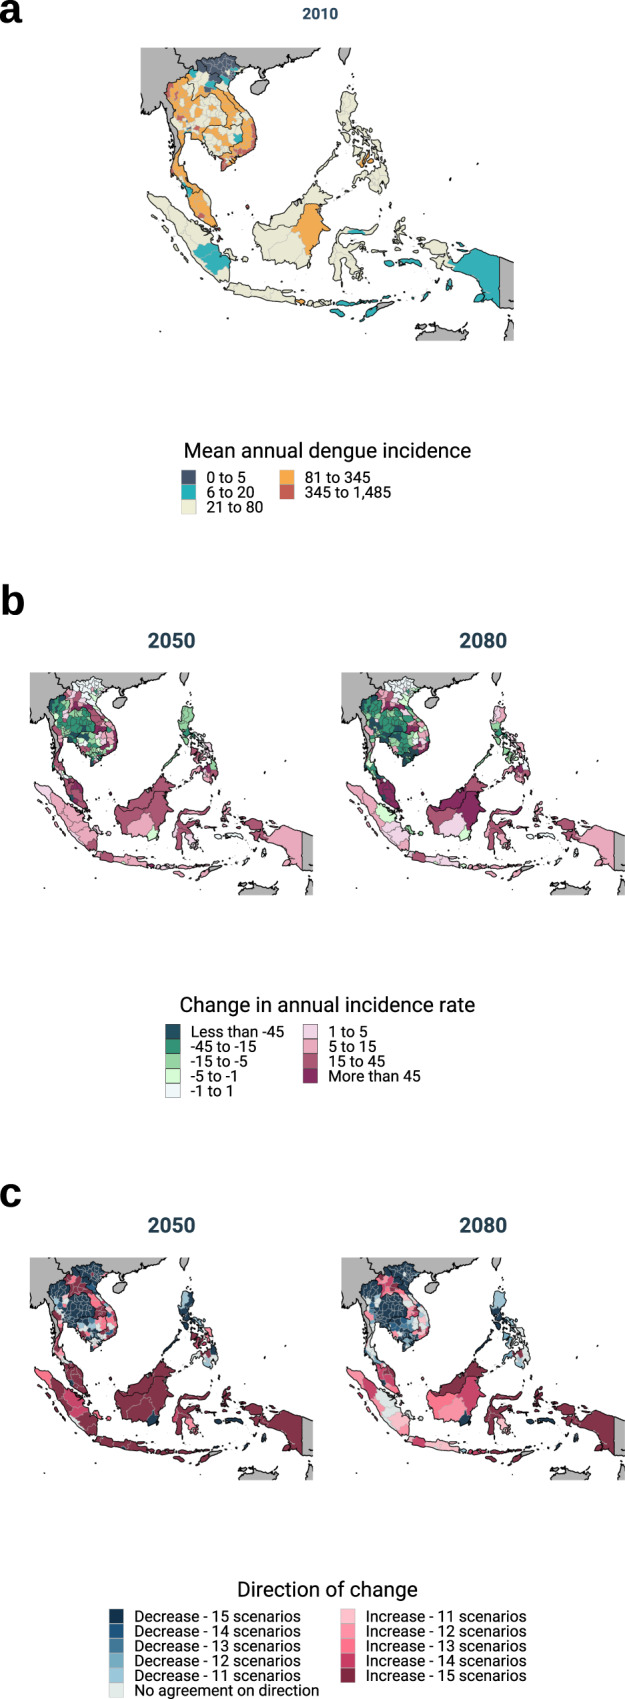
a Mean annual crude dengue incidence rate per 100,000 over the period 2000–2017 (equal intervals in the logarithmic scale; n = 216 months). b Predicted change in the mean annual crude dengue incidence rate over the periods 2050 and 2080 (n = five general circulation models examined over 360 months respectively). Green colours indicate a decrease and purple colours indicate an increase in incidence. c Between-model agreement in the direction of the predicted change in future dengue incidence. Blue colours indicate a decrease in incidence and purple colours indicate an increase. Source data are provided as a Source data file.