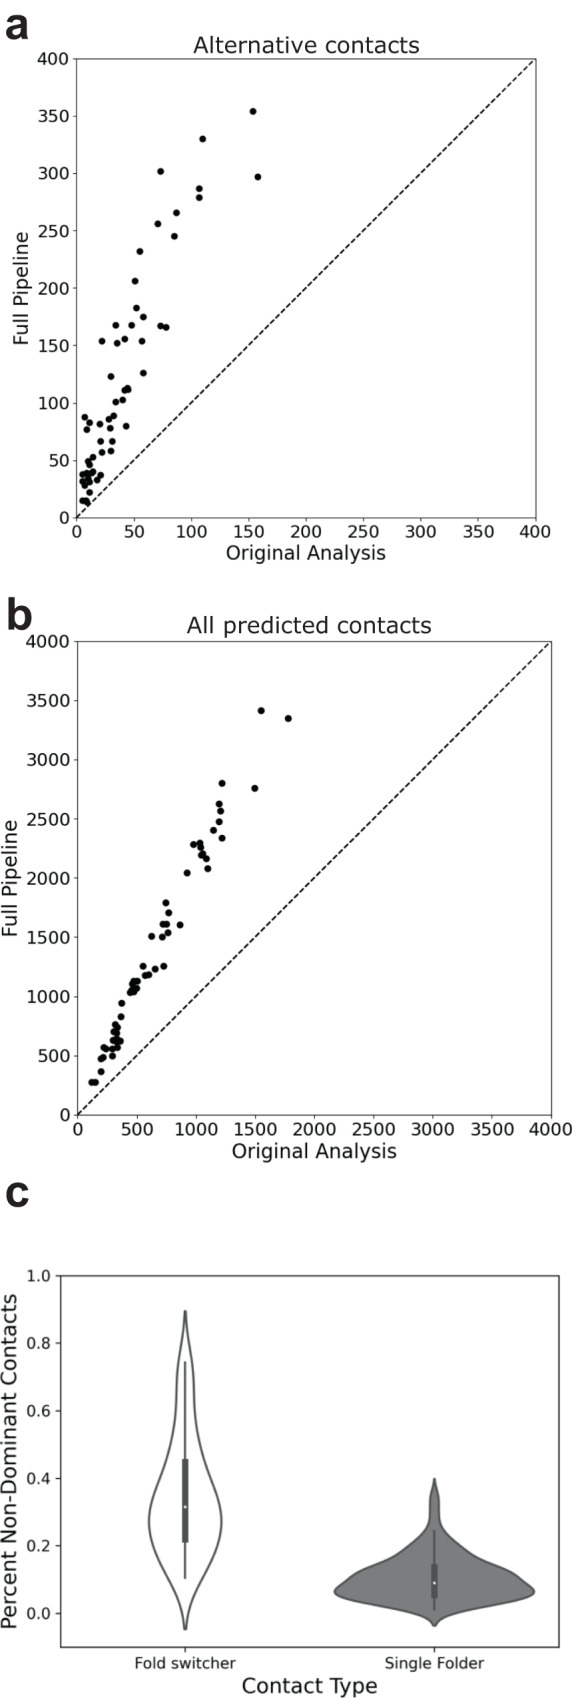
Fig. 3. ACE amplifies correctly predicted contacts for fold-switching proteins.

Amplification is observed for 56/56 predicted contacts uniquely corresponding to the alternative fold (a) and for all predicted contacts (b). Identity lines in both plots are dashed lines. c Amplification of alternative contacts occurs much more frequently in fold switchers than among single folders. Violin plots show the distributions of %non-dominant contacts for fold-switching and single-fold proteins. The left and right distributions were generated from n = 56 and n = 181 datapoints, respectively. Inner bold black boxes span the interquartile ranges (IQRs) of each distribution (first quartile, Q1 through third quartile, Q3); medians of each distribution are white dots, lower line (whisker) is the lowest datum above Q1-1.5*IQR; upper line (whisker) is the highest datum below Q3 + 1.5*IQR. Source data are provided as a Source Data file.
