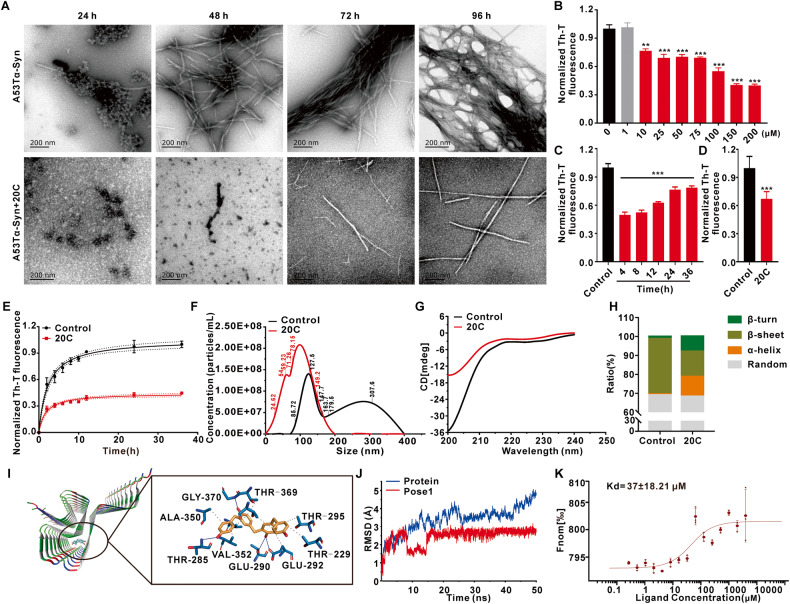
Fig. 1. 20C inhibits A53T α-Syn aggregation in vitro.
A Representative TEM images in absence (upper) and presence (bottom) of 20C (100 μM) at different time. B Inhibition of A53T α-Syn aggregation by 20C revealed by Th-T fluorescence from 1 to 200 μM after incubation of 96 h. Normalized to the group of 0 μM. C Inhibitory effect of 20C (100 μM) on the maturation of α-syn aggregates from different states. 20C was dropped into the aggregation solution after 4, 8, 12, 24, 36 h of incubation, and their aggregation mature status was determined at the time of 96 h. D The end point (96 h) of A53T α-Syn with or without (control) of 20C (100 μM). E A53T α-Syn aggregation kinetics in the absence (control) and presence of 20C followed by Th-T derived fluorescence. Normalized to the end point Th-T fluorescence of the control group at the time of 36 h. F Determination of the fibril size population in absence (black) and presence (red) of 20C using nano ZS system. G Representative image of CD spectroscopy for the secondary structure of full-length α-Syn in absence (black) and presence (red) of 20C. H α-Syn secondary structure contents affected by 20C. I The binding mode based on 20C-fibril interaction dynamics simulation, overall view (left) and local view (right). The yellow rod-like structure is 20C, the blue rod-like structure is a protein residue, the blue solid line represents hydrogen bonding, and the gray dotted line represents hydrophobicity. J RMSD results of 20C-fibril complex with time in the simulation process. K Dose–response curve of 20C and α-Syn fibrils interaction determined by MST. Error bars are represented as SEM of mean values, n = 3. **p < 0.01, ***p < 0.001 vs. the control group.

