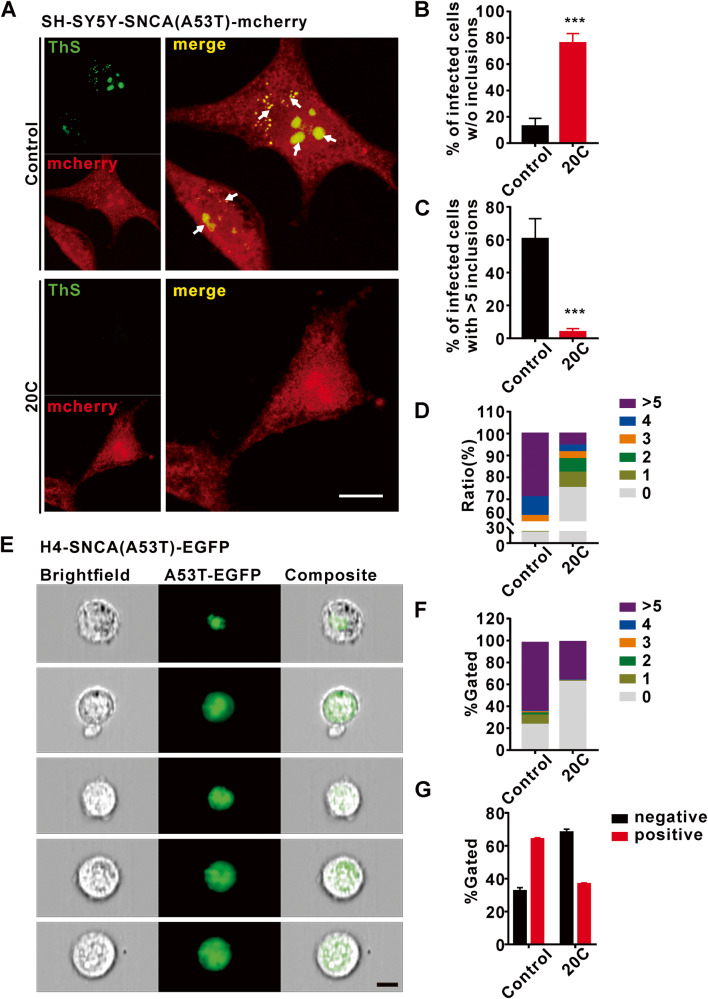
Fig. 2. 20C inhibited of α-Syn aggregate in SNCA (A53T) overexpression neurons.
A Representative immunofluorescence images from SNCA (A53T)-SY5Y neurons treated with (bottom) or without 20C (Top). Scale bar = 10 µm. B Percentage of infected cells devoid of α-Syn aggregates. C Percentage of infected cells bearing >5 α-Syn aggregates. D Percentage of infected cells of infected SNCA (A53T)-SY5Y containing different α-Syn aggregates. E Representative immunofluorescence images of EGFP-positive cells revealed by imaging flow cytometry. Images of positive cells with 1, 2, 3, 4, >5 α-Syn aggregates are represented from top to bottom. F Percentage of infected cells of infected SNCA (A53T)-H4 containing different α-Syn aggregates. G Percentage of infected positive cells. Error bars are represented as SEM of mean values, n = 3. ***p < 0.001 vs. the control group.

