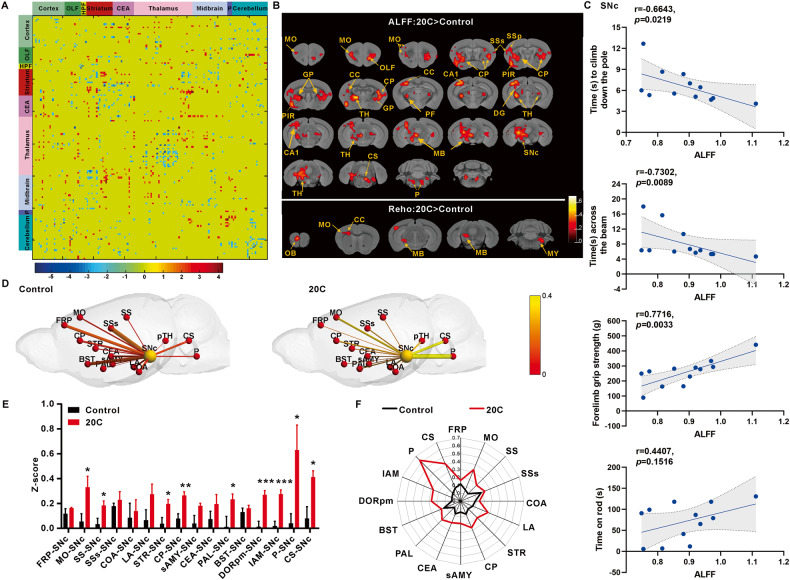
Fig. 4. 20C improved the functional connectivity in α-Syn A53T transgenic mice.
A Matrix representation of the whole-brain functional connectome (151 ×151 nodes) in the mouse brain, obtained from the T-value of two-sample t-test. B Statistical results of ALFF and ReHo in 20C group in comparison with that in control group. The voxel-level height threshold of ALFF was p < 0.01 (uncorrected) and the cluster-extent threshold were 20 voxels. The voxel-level height threshold of ReHo was p < 0.01 (uncorrected) and the cluster-extent threshold were 10 voxels. Brain regions with significant differences are indicated by different colors according to T-values. HPF Hippocampal formation, CEA Central amygdalar nucleus, MO Motor cortex, SSs Supplemental somatosensory area, SSp Primary somatosensory area, GP Globus pallidus, PIR Piriform area, CC Corpus callosum, TH Thalamus, CP Caudoputamen, PF Parafascicular nucleus, CA1 Field CA1, DG Dentate gyrus, MB Midbrain, SNc The compact part of substantia nigra, P Pons, OB Olfactory bulb, MY Medulla. C The relationship between the assessed motor behaviors and the ALFF changes in SNc induced by A53T and 20C. D The functional connectivity between pairs of nodes is marked by lines of increasing thickness with increasing Z-score values, indicating increasing functional connectivity. The color size of the nodes distinguishes the SNc from other brain regions. E Z-score values histogram of connections between SNc and other brain regions. F Z-score values of connections of SNc to other brain regions used a radar map. Error bars are represented as SEM of mean values, n = 3. *p < 0.05, **p < 0.01, ***p < 0.001 vs. control group.

