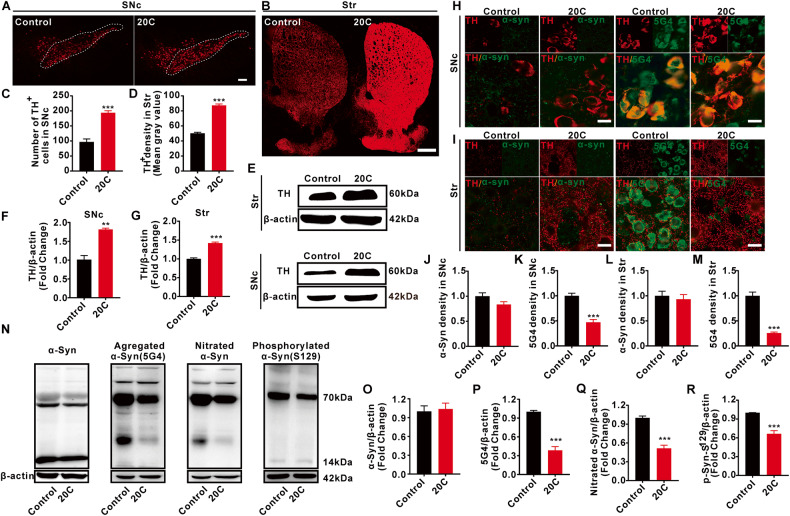
Fig. 5. Protective effect of 20C on the nigrostriatal system.
A 20C inhibited the loss of DA neurons in SNc revealed by immunofluorescence. Scale bar = 100 µm. B 20C reduced the loss of DA fibers in striatum (Str). Scale bar = 500 µm. C Quantification analysis of DA neurons in SNc. The cell count for the SNc was obtained using a dot counting method to determine the number of positive neurons. D Quantification analysis of DA fibers in Str. The mean optical density value of TH-positive staining in Str was quantified using Fuji software. E Representative immunoblot of TH protein levels in SNc and Str. F, G Quantification analysis of TH protein levels in SNc or Str. H, I Representative immunofluorescence images of the levels of α-Syn or aggregated α-Syn (5G4) in TH-positive neurons. Scale bar=20 µm. J Quantification analysis of α-Syn density in SNc. K Quantification analysis of 5G4 density in SNc. L Quantification analysis of α-Syn density in Str. M Quantification analysis of 5G4 density in Str. N Representative immunoblot of α-Syn and its modified forms in SNc. O–R Quantification analysis of (N). Normalized to the control group. Error bars are represented as SEM of mean values, n = 3. **p < 0.01, ***p < 0.001 vs. control group.

