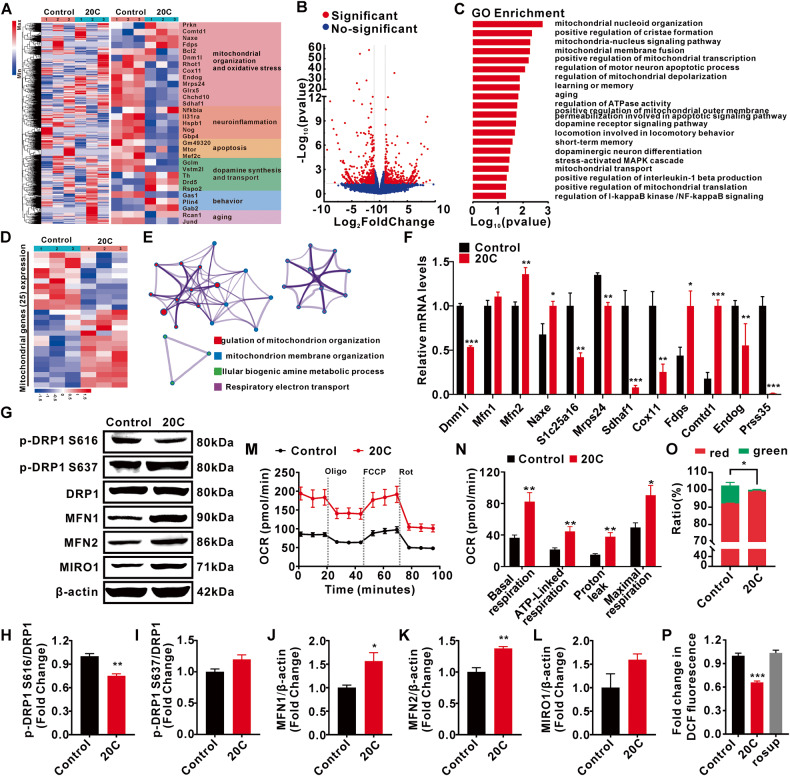
Fig. 6. Gene expression analysis of SNc in A53T α-Syn transgenic mice treated with 20C.
A Hierarchical clustered heatmap of gene expression profiles in SNc of A53T α-Syn transgenic mice treated by 20C or vehicle (Left). Heatmap of differentially expressed genes (DEGs) of A53T α-Syn transgenic mice treated with 20C or vehicle (control) (Right). B Volcano plot of DEGs between 20C and control animals. Significantly altered genes are colored in red, the rest genes are colored in blue. C Gene Ontology enrichment of DEGs. D Heatmap of differential mitochondrial genes of transgenic mice treated with 20C or vehicle (control). E Enrichment analysis for Gene Ontology terms among the mitochondrial genes of a gene–trait correlation module was performed using Metascape. F Relative mRNA levels of the mitochondrial genes in SNc. G Representative immunoblot of mitochondrial fusion and fission proteins in the SNc. Quantification analysis (normalized to actin or DRP1) revealed expression levels of p-DRP1 S616 (H), p-DRP1 S637 (I), MFN1 (J), MFN2 (K), and MIRO1 (L) in the SNc. M Real-time changes in oxygen consumption rate (OCR) were measured using the cellular energy metabolism analyzer (Seahorse XF24 Analyzer). Normalization of agilent seahorse XF data by in situ cell counting using a BioTek Cytation C10. N Quantification of basal respiration, ATP production, proton leak, and maximal respiration. O Mitochondrial membrane potential was stained with JC-1, and then assessed using imaging flow cytometry. P Intracellular ROS production was detected using DCFH-DA. (rosup was a positive control probe). Error bars are represented as SEM of mean values, n = 3. *p < 0.05, **p < 0.01, ***p < 0.001 vs. control group.

