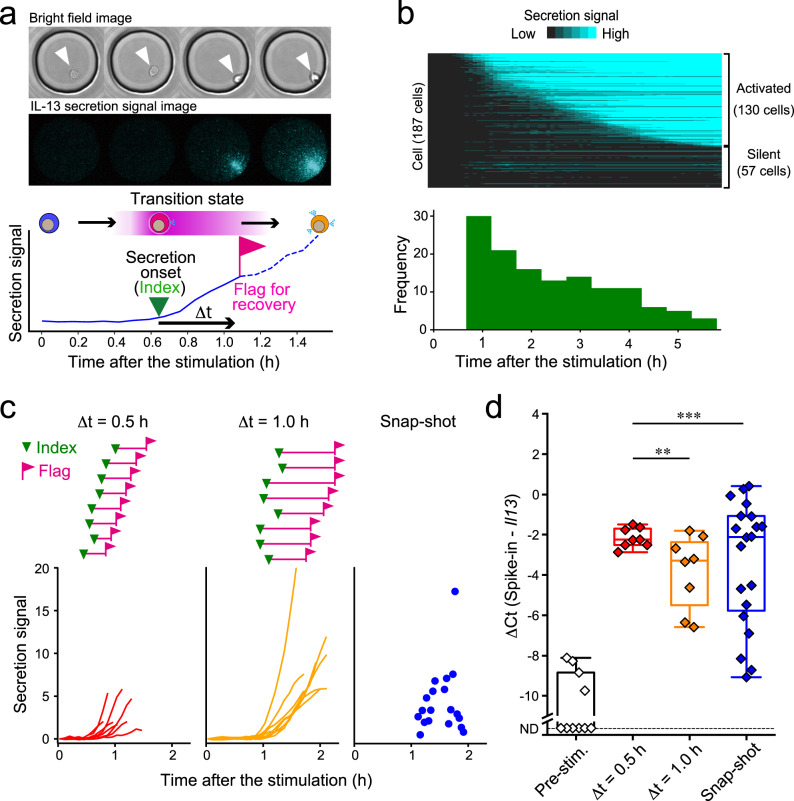
Fig. 2. The TDCSS technique found a uniform Il13 mRNA level of mILC2 in transition state.
a Time-lapse images and intensity trace of IL-13 secretion signal from a stimulated mILC2 acquired by LCI-S. b Heatmap of IL-13 secretion signal from individual mILC2s and a histogram of their secretion onset times. c IL-13 secretion onset (inverted triangle), recovery timing (flag), and signal trace (bottom) of each mILC2 subjected to qRT-PCR analysis. d Box plots showing the median and interquartile range of Il13 mRNA levels after stimulation. Whiskers represent minimum and maximum values. ND: not detected. **P < 0.01, ***P < 0.001, F-test.

