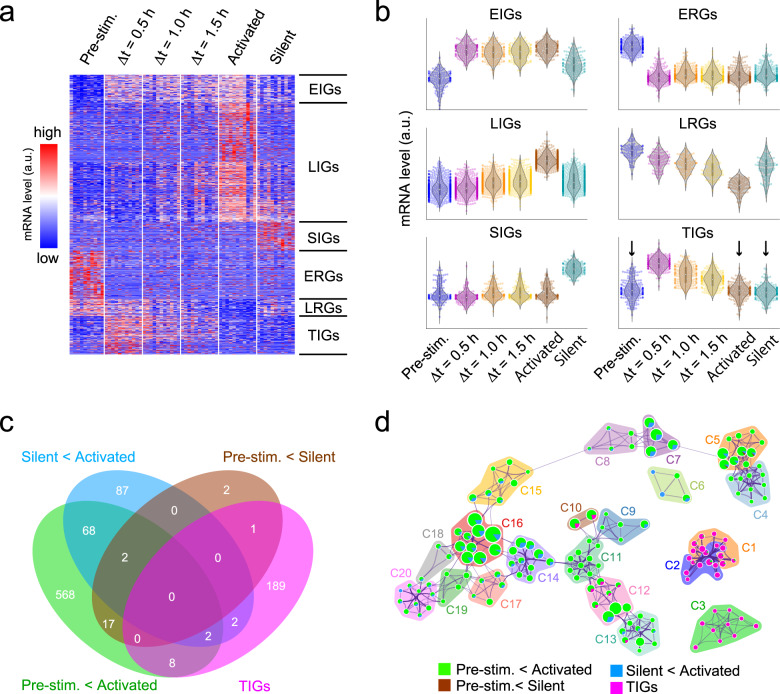
Fig. 3. Unbiased characterisation of gene expression during ILC2’s activation process.
a Heat map depicting the expression levels of 1471 differentially expressed genes (DEGs). b The trend of relative expression levels of genes in six transition classes. Additional information about each class can be found in Supplementary Data 1. c Overlap of the TIGs with the specified DEGs. d Network visualization of enriched ontology clusters of the TIGs and specified DEGs by using Metascape. Each node represents an enriched ontology cluster. The size of the node indicates the number of hit genes, while the pie chart illustrates the proportion of hit genes in the list. Clusters C1–C20, classified by similarity of enriched terms, are depicted in each coloured area. Additional information about each cluster can be found in Supplementary Data 2.

