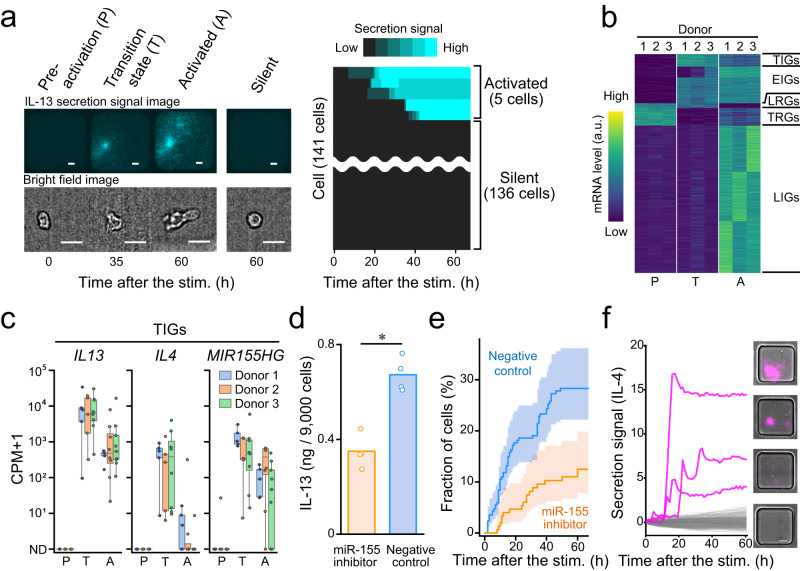
Fig. 4. Identification of genes expressed in different activation steps from human specimens.
a Representative time-lapse images of secretion signal and cell morphology (left) and heatmap of IL-13 secretion signal (right) of individual hILC2s. Scale bar, 25 µm. b Heatmap showing the average mRNA levels in each activation state of each specimen in standard scores (z-score). Details of each class are provided in Supplementary Data 6. c Box plot illustrating the expression levels of representative TIGs; IL13, IL4 and MIR155HG in each activation state. Each colour represents a different specimen. The centre line, box limits, whiskers, and dots indicate the median, upper and lower quartiles, 1.5x interquartile range and individual cells, respectively. ND: not detected. d Comparison of IL-13 production in cultured human ILC2 with and without miR-155 inhibitor by ELISA of bulk culture supernatants. Inhibition was performed by electroporation of a synthetic miRNA inhibitor with miR-155 specific or control sequence. e Comparison of temporal changes in the estimated proportion of IL-13-secreting cells in cultured human ILC2s with and without miR-155 inhibitor using the Nelson-Aalen estimator with their respective 95% confidence intervals (coloured bands). The number of cells in negative control and inhibition were 259 and 153, respectively. The difference between them was compared with the log-rank test (observed p value = 0.0013). f Secretion signal traces and images of IL-4 producing individual hILC2s. Three secretion-positive traces are shown in magenta and other traces are shown in grey (388 traces).

