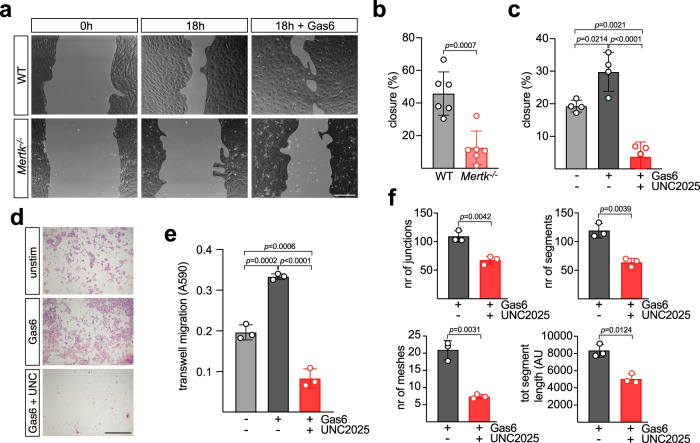
Fig. 4. Mer regulation of BEC physiology in vitro.
a Representative images of scratch assays performed in WT (top panels) or Mertk−/− (lower panels) BECs over 18 h in the absence or presence of 10 nM Gas6. b Quantification of scratch closure (see Methods) in WT versus Mertk−/− BECs in six independent experiments. c Quantification of scratch closure in WT BECs ∓ Gas6 (10 nM) and ∓UNC2025 (300 nM) in the indicated number of experiments. d Representative Crystal Violet staining of migrated BECs on the upper surface of a transwell membrane after 20 h unstimulated (top), with 10 nM Gas6 (middle), or with 10 nM Gas6 and 300 nM UNC2025 (bottom). e Quantification of transwell migration results as in (e) (see Methods), for three independent experiments. f Quantification—performed using Fiji software with the Angiogenesis Analyzer plugin - of the number of endothelial junctions (top left), segments (top right), meshes (lower left), and total segment length (lower right) 5 h after BECs were added to Geltrex basement membrane in the presence of 10 nM Gas6, ∓300 nM UNC2025. In all panels, data show the mean ±1 SD, and data points indicate independent experiments performed on separate batches of isolated BECs. Statistical significance of differences was evaluated with an unpaired t test (b, f) and with a one- way ANOVA using a Dunnett’s post test (c, e). Scale bars: a 200 μm and d 1 mm.

