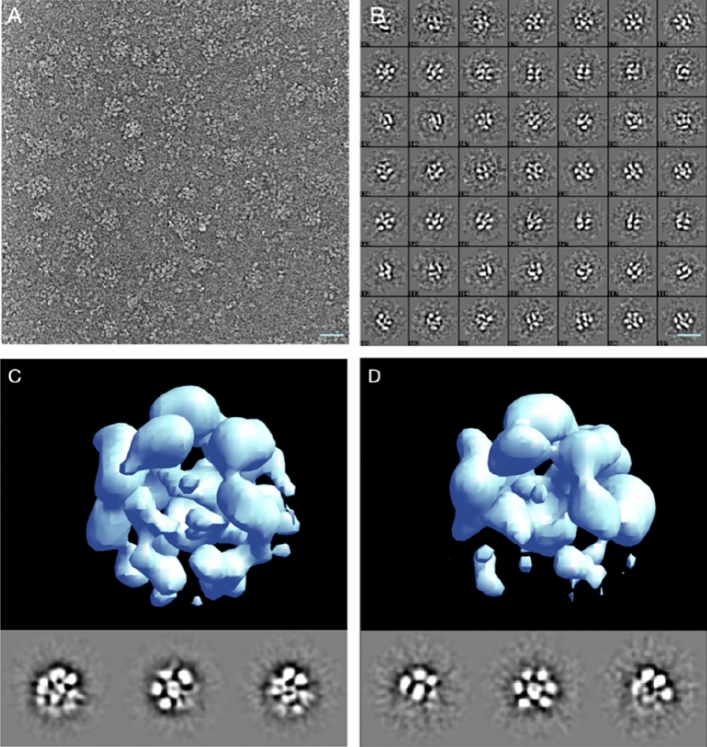
Figure 3.
Single particle cryoEM analysis of MBP-FL Vpu soluble oligomers. (A) A micrograph showing representative oligomers and dissociated monomers; (B) representative unsupervised 2-D class averages from 14,657 particles; (C,D) single-particle reconstruction of the two identified particle populations with 11,541 (C) and 2815 (D) respectively. The three images below each 3-D map are the 3 orthogonal projections of the map, making the lower density regions easier to observe. The scale bar is 20 nm.

