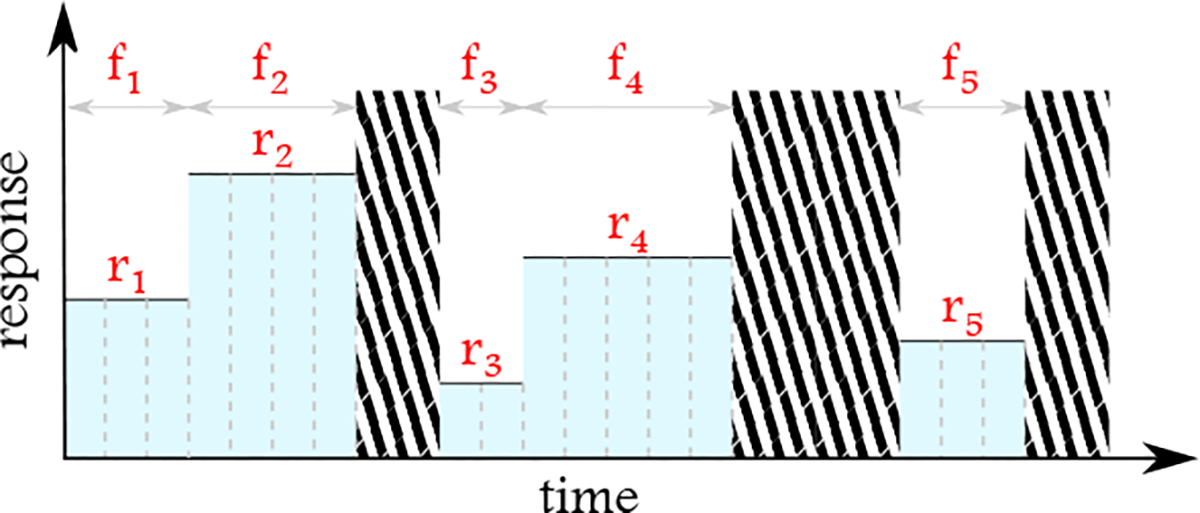
Figure 2:

For the computation of mean, median, and standard deviation, in addition to absolute values, the frequency of the corresponding values at the minute level is taken into account. For example, the adjusted mean for the response in this figure would be . The areas with stripes are duration without any values recorded for the response.
