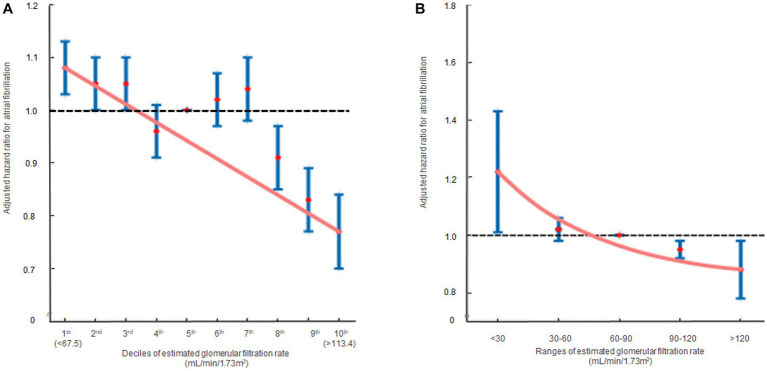
Figure 3.
The hazard ratios representing the association between renal function and atrial fibrillation occurrence are displayed in two formats: (A) decile groups and (B) range groups. The solid blue line shows the multivariate adjusted hazard ratios with 95% confidence intervals for each group, while the dashed lines indicate a hazard ratio of 1. The red line represents the restricted cubic spline curves. Hazard ratios were calculated using the multivariable Cox model shown in Table 2.

