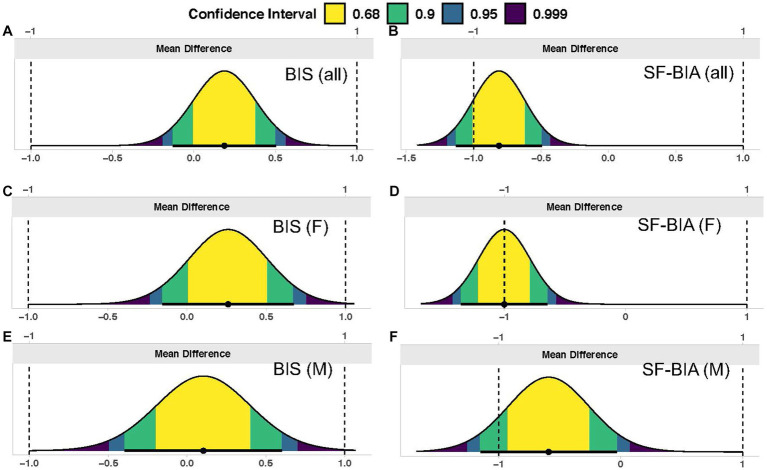
Figure 1.
Equivalence testing. In each panel, the distribution of mean differences is displayed, along with confidence intervals. The entirety of a 90% two one-sided t-tests (TOST) interval being contained within the specified equivalence region (±1 liter) indicates statistical equivalence between the deuterium oxide criterion and a given bioimpedance technique. Results for the entire sample (n = 130) are displayed for (A) BIS (ImpediMed SFB7) and (B) SF-BIA (RJL Quantum V); results for females only (F; n = 70) are displayed for (C) BIS and (D) SF-BIA; and results for males only (M; n = 60) are displayed for (E) BIS and (F) SF-BIA.

