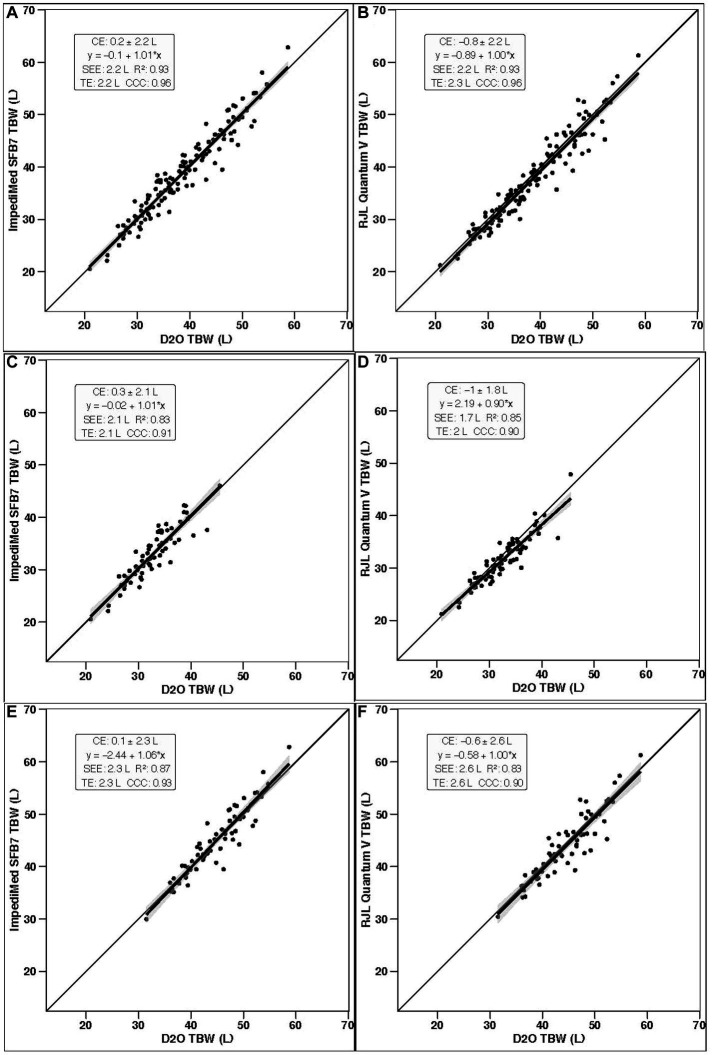
Figure 2.
Line of identity comparisons. In each panel, the ordinary least squares regression line indicating the performance of both bioimpedance devices for estimating total body water (TBW) as compared to the line of identity (i.e., perfect agreement with the deuterium oxide criterion) is displayed. The shaded regions indicate the 95% confidence limits for the regression line. Constant error (CE), regression line equations, standard error of the estimate (SEE), coefficient of determination (R2), total error (TE), and Lin’s concordance correlation coefficient (CCC) are also presented. Results for the entire sample (n = 130) are displayed for (A) BIS (ImpediMed SFB7) and (B) SF-BIA (RJL Quantum V); results for females only (n = 70) are displayed for (C) BIS and (D) SF-BIA; and results for males only (n = 60) are displayed for (E) BIS and (F) SF-BIA.

