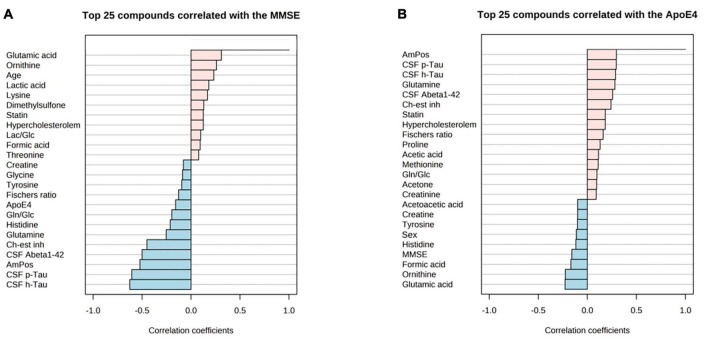
FIGURE 6.
PatternHunter (Pearson correlation plots) for MMSE (A), ApoE4 (B) with NMR-based metabolomics in blood serum when comparing Alzheimer’s disease (AD) with controls (Con) and mild cognitive impairment (MCI): Each plot is a graphical representation of the top 25 other variables that were displaying the highest absolute correlation values (both positive, up to 1.0, and negative, down to –1.0). Correlations from the study were highlighted (positive correlations marked red, negative – blue). MMSE, mini-mental state exam. ApoE-4 – amount of (0–2 copies) of the apoE-4 allele.

