. 2023 Aug 24;5(4):e230016. doi: 10.1148/ryct.230016

Figure 4:

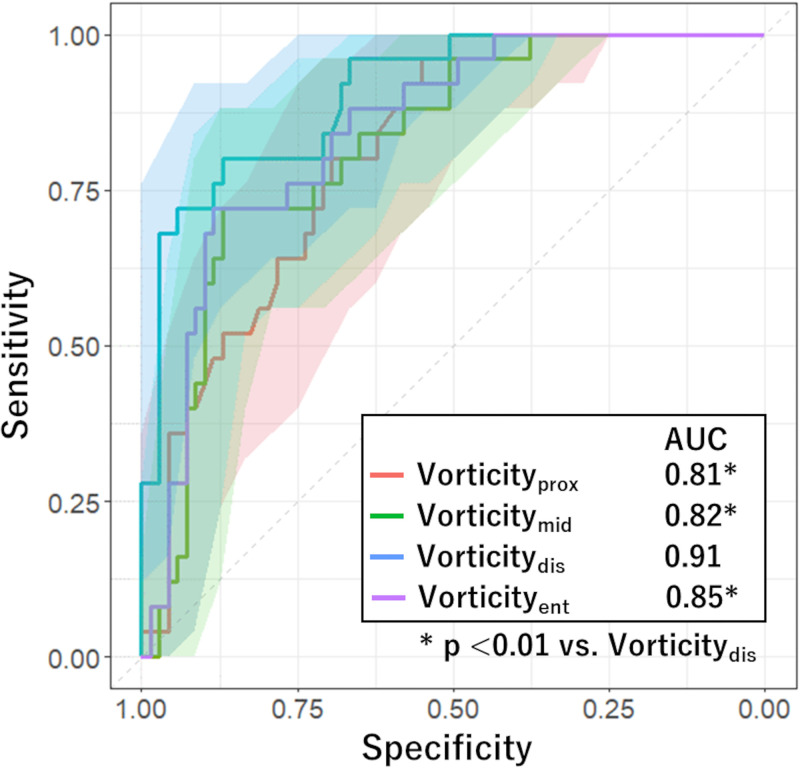
Graph shows comparison of receiver operating characteristic curves estimating performance of risk factors in predicting functional plaque progression. The area under the receiver operating characteristic (AUC) curve of the model including vorticity of distal stenosis (vorticitydis) was significantly higher than those in the remaining models (P < .01). Shaded areas represent 95% CI band. Vorticityent = vorticity of entire stenosis, Vorticitymid = vorticity of middle stenosis, Vorticityprox = vorticity of proximal stenosis.

Graph shows comparison of receiver operating characteristic curves estimating performance of risk factors in predicting functional plaque progression. The area under the receiver operating characteristic (AUC) curve of the model including vorticity of distal stenosis (vorticitydis) was significantly higher than those in the remaining models (P < .01). Shaded areas represent 95% CI band. Vorticityent = vorticity of entire stenosis, Vorticitymid = vorticity of middle stenosis, Vorticityprox = vorticity of proximal stenosis.