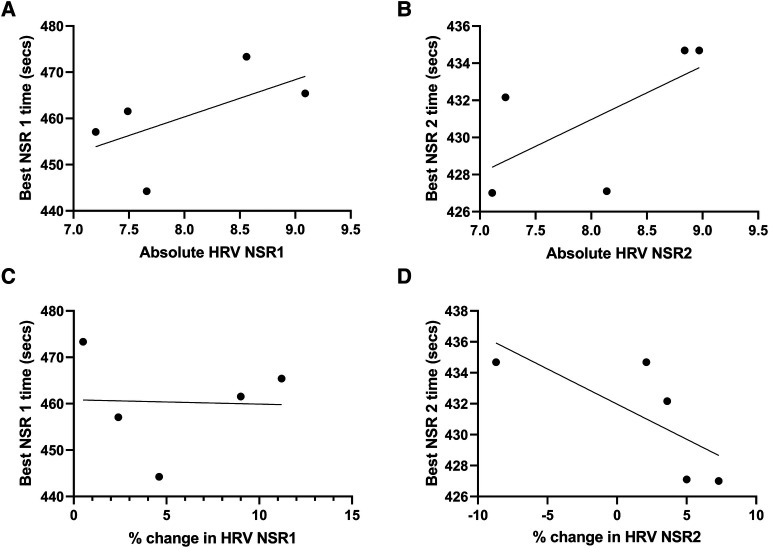
Figure 3.
The relationship between on-water performance and average absolute LnRMMSD and % change in LnRMMSD during NSR 1 & 2 in elite female rowers (n = 5). (A) Absolute HRV (LnRMSSD) and best NSR 1 performance, (B) absolute HRV (LnRMSSD) and best NSR 2 performance, (C) % change in HRV (LnRMSSD) and best NSR 1 performance, (D) % change in HRV (LnRMSSD) and best NSR 2 performance.

