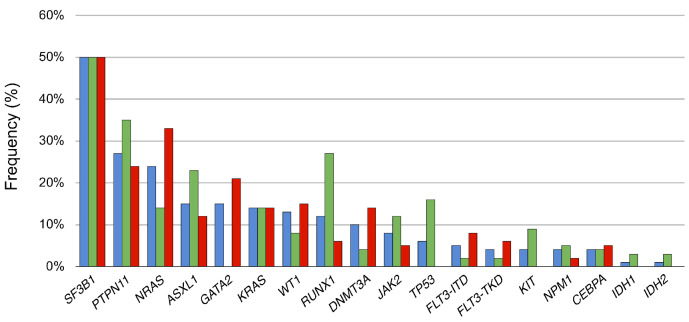
Figure 1.
Frequency of gene mutation in acute myeloid leukemia with inv(3)/t(3;3). The bars represents the frequency of gene mutations in the global cohort (blue bar), the newly diagnosed cohort (green bar) and relapsed/refractory cohort (red bar). The number of patients with available mutational data differ for each gene represented on this figure. The number of patients tested and the number of patients with mutation for each gene is detailed in the Online Supplementary Table S1.

