

Abstract
Background and Hypothesis
Around 5%–7% of the adult population are estimated to have lifetime psychotic experiences (PEs), which are associated with psychosis risk. PEs assessed with Community Assessment of Psychic Experiences (CAPE) are associated with psychosis but also non-psychotic disorders, which could be partly explained by CAPE indirectly capturing emotional symptoms. We investigated the psychometric properties of a shorter version, CAPE-9, and whether CAPE-9 scores are associated with lifetime psychotic or non-psychotic mental disorders after controlling for current anxiety and depressive symptoms.
Design
CAPE-9 questionnaire data were obtained from 29 021 men (42.4 ± 5.6 yrs.) from the Norwegian Mother, Father, and Child Cohort Study. We investigated CAPE-9 reliability and factor structure. Logistic regression was used to test effects of current anxiety and depressive symptoms (SCL-12) on associations between CAPE-9 scores and psychiatric diagnoses.
Results
CAPE-9 fit a previously reported 3-factor structure and showed good reliability. Twenty-six percent reported at least one lifetime PE. CAPE-9 scores were significantly associated with most psychiatric disorders (schizophrenia, depression, bipolar disorder, substance abuse, anxiety, trauma-related disorders, and ADHD). After controlling for concurrent emotional symptoms, only associations with schizophrenia (OR = 1.29; 95% CI = 1.18–1.38) and trauma-related disorders (OR = 1.09; CI = 1.02–1.15) remained significant.
Conclusions
CAPE-9 showed good psychometric properties in this large population-based adult male sample, and PEs were more clearly associated with psychotic disorders after controlling for current emotional symptoms. These results support the use of the short CAPE-9 as a cost-effective tool for informing public health initiatives and advancing our understanding of the dimensionality of psychosis.
Keywords: psychotic experiences, mental illness, psychometrics, public health
Introduction
Around 5%–7% of the adult general population report lifetime delusions, hallucinations, or bizarre experiences without meeting the criteria for a psychotic disorder.1,2 These subclinical psychotic experiences are associated with transition to clinical psychosis3–5 but are several times more prevalent,1,2,6,7 suggesting a psychosis continuum.8–10 Psychotic experiences (PEs) frequently co-occur with primarily non-psychotic mental disorders, such as substance abuse, depression, anxiety, and PTSD .5,11–13 Because of this, PEs are suggested as a severity marker of general mental illness and not only a psychosis risk factor.10 PEs are associated with increased help-seeking behavior,1,4 and there is an apparent dose–response relationship between PEs and disability.14–17 Thus, measures of PEs often show nonspecific associations with diagnostic and functional outcomes and may represent more global mental challenges. To estimate its public health impact, there is a need to better understand the relationship between PEs and mental illness. A prerequisite for this is scalable questionnaires that are useful in measuring PEs in general populations.
Community Assessment of Psychic Experiences (CAPE18,19) is a popular self-report measure of lifetime PEs in population-based samples. Through cross-national validation, the long-form CAPE-42 is demonstrated to measure the same mental phenomena independent of cultural and language differences.20 The original 42-item version comprises 3 symptom scales: Positive, negative, and depressive symptoms.19 Research suggests the positive symptom scale is the most effective in predicting subsequent psychosis,21,22 and as large cohort studies are dependent on cost-effective instruments, shorter versions of the positive subscale, like CAPE-15 and CAPE-9, have been designed.23 While previous versions of the CAPE, including CAPE-15 and CAPE-42, are validated in several populations,19,24 the psychometric properties of CAPE-9, the shortest version to date, have not been used in previous samples and must be tested to evaluate its usefulness.
Several studies have investigated the association between PEs and non-psychotic mental disorders. In a large-scale World Health Organization mental health survey, McGrath et al observed associations between PEs and a wide range of mental disorders beyond psychosis,12 replicating previous findings.5,25,26 It is unknown what these nonspecific associations between PEs and non-psychotic mental disorders entail. PEs may occur at a higher rate in most psychiatric disorders, not only psychotic disorders, thus representing a transdiagnostic phenomenon.10 Alternatively, instruments assessing PEs might capture general distress and emotional symptoms, which could contribute to the observed associations between PEs and non-psychotic diagnoses. Anxiety and depressive symptoms are present in most psychiatric diagnoses.27–29 In addition, the CAPE positive symptom scale is associated with both increased levels of distress and depressive symptoms.30–32 However, PEs are not related to depressive symptoms or distress in everyone who experiences them.1,33,34 Furthermore, even though modern PE assessment tools were designed to explicitly capture experiences on the psychosis continuum, retrospective self-report measures of mental phenomena are observed to be affected by the current mental state of the respondent.35,36 Individuals tend to overestimate lifetime mental symptoms if they are simultaneously reporting higher current negative affect.37 This may also be true for PE self-report measures. Hence, it is important to investigate whether CAPE-9 scores are associated with multiple mental disorders and whether scores are more clearly associated with psychotic disorders after controlling for current mental state, eg, anxiety and depression.
Increasing our understanding of the specific relationship between community measures of lifetime PEs and current diagnostic outcomes could enhance screening of psychotic disorders in general populations and improve our understanding of the health impact of PEs on individuals without psychotic disorders. In the current study, we assessed the usefulness of a PE measure (CAPE-9) by investigating its psychometric properties (reliability and factor structure) and exploring the frequency and distress of lifetime PEs in a large population-based sample (n = 29 021). Based on previous literature, we hypothesized (1) that higher reported lifetime frequency and related distress of PEs are positively associated with multiple mental disorders (derived from the Norwegian Patient Registry) and (2) that this association becomes more specific to schizophrenia when we adjust for current anxiety and depressive symptoms. Our goal was to test CAPE-9 as an instrument for capturing psychotic traits and lifetime psychotic disorders in an adult population sample.
Methods
Participants
The Norwegian Mother, Father, and Child Cohort Study (MoBa) is a population-based pregnancy cohort study conducted by the Norwegian Institute of Public Health. Between 1999 and 2008, all women in contact with recruitment sites (prenatal health care clinics in all Norwegian municipalities) and their partners were invited to participate. The women consented to participate in 41% of invited pregnancies. At week 15 of pregnancy, fathers were asked to contribute with blood samples, an initial questionnaire, and approved linkage to health registries.38,39 All participants gave informed written consent. In 2015, fathers were contacted for a follow-up questionnaire about health and lifestyle,38 which included the CAPE-9. Current analyses are based on questionnaires and diagnostic registry data collected as part of this follow-up assessment (n = 29 021).
The establishment of MoBa and initial data collection was based on a license from the Norwegian Data Protection Agency and approval from the Regional Committees for Medical and Health Research Ethics. The Norwegian Health Registry Act regulates the MoBa cohort, and the Regional Committees for Medical and Health Research Ethics approved the present study (2016/1226/REK sør-øst C).
Measures
Psychiatric Diagnoses
Psychiatric diagnoses from 2008 to 2018 were derived from the Norwegian Patient Registry, a specialist healthcare registry using codes from the ICD-10.40 Diagnoses included schizophrenia (F20), depressive disorders (F32, F33), bipolar disorder (F31), substance use disorders (F1x.1, F1x.2), anxiety disorders (F40.0, F40.1, F40.2, and F41.0), obsessive-compulsive disorder (F42), trauma- and stressor-related disorders (F43.0, F43.1, and F43.2), somatoform disorder (F45), and ADHD (F90).
Symptom Measures
CAPE-9, presented in table 1, is a 9-question version of the previously validated CAPE-15 measure,23 based on the original 20-item positive symptom scale from CAPE-42.18,19 The scale is a self-report of lifetime PEs (PE) in the general population. Studies suggest an internal 3-factor structure of the complete positive symptom scale consisting of persecutory ideation, bizarre experiences, and hallucinations.23,41 Each item has 2 subscales—a question about the frequency of an experience and a question about the distress caused by said experience. There are 4 possible responses to frequency of symptoms (“Never,” “Occasionally,” “Often,” and “Almost constantly”) and distress (“Not at all,” “A little,” “Quite a lot,” and “A lot”). Sum scores range between 9 and 36 in both subscales. We did not remove any outliers as PEs will vary considerably in patient and non-patient populations.
Table 1.
CAPE-9 Questions—Self-Reported Lifetime Psychotic Experiences
| Subscales | Items | The thoughts and feelings described here may seem unique to you, but they are more common than you might think. Frequency. How often have you been having these feelings or thoughts? Distress. If you have experienced this, how affected are you by the experience? |
|---|---|---|
| Persecutory ideation | 1. Delusions of reference | 1. Have you ever felt that what is printed in magazines and newspapers or said on TV specifically applies to you? |
| 2. Beliefs about stalking | 2. Have you ever felt that someone is stalking you in some way? | |
| 3. Beliefs about conspiracy | 3. Have you ever felt that other people are conspiring against you? | |
| Bizarre experiences | 4. Electrical influence | 4. Have you ever felt that electrical appliances, such as PCs, can affect your thoughts? |
| 5. Thought insertion | 5. Have you ever felt that the thoughts in your head are not your own? | |
| 6. Thought broadcasting | 6. Have your thoughts sometimes been so vivid that you have been worried other people might hear them? | |
| Perceptual abnormalities | 7. External control | 7. Have you ever felt that there is another force outside of you who is in control of you? |
| 8. Auditory hallucinations | 8. Have you ever heard voices when you were completely alone (not radio or TV)? | |
| 9. Visual hallucinations | 9. Have you ever seen objects, people, or animals that no one else can see? |
Anxiety and depressive symptoms during the past 2 weeks were based on the Symptoms Checklist-12 (SCL-12 – selected items from the Hopkins Symptoms Checklist 9042–44). Sum scores for SCL-12 range between 0 and 48. Sum scores for SCL-12 range between 0 and 48. In describing relevant sample characteristics, alcohol use during the past 12 months was assessed with AUDIT (Alcohol Use Disorders Identification Test45) with sum scores ranging from 0 to 40. Questions on lifetime and current cannabis use were also included.
Statistical analyses
Analyses were conducted using R, version 4.0.3. We used Welsh’s 2-sample t-test and Pearson’s Chi-squared test with Yates’ continuity correction to compare CAPE-9 sum scores in those with and without lifetime psychiatric diagnoses.
We measured scale reliability using omega estimates.46 We conducted a confirmatory factor analysis based on the previously observed 3-factor structure of the CAPE-15 frequency scale23,41 using the lavaan package (version 0.6-1247). Accounting for skewness, we used the diagonally weighted least squares method. A good confirmatory factor analysis model fit was evaluated as Standardized Root Mean Square Residual (SRMR) < 0.08, Root Mean Square Error of Approximation (RMSEA) <0.06, and comparative fit index >0.95.48 The cutoff for adequate factor loadings was set at 0.3.
Binomial logistic regression was used to investigate associations between frequency and distress sum scores and diagnoses. To compare effect estimates, frequency and distress sum scores were standardized with z-transformation. All psychiatric diagnoses were included to explore potential independent associations between frequency and distress sum scores (explanatory), respectively, and diagnoses (outcome variables). We further tested the influence of current anxiety and depressive symptoms (SCL-12) on both models. We then explored associations between specific CAPE items (explanatory) and psychiatric diagnoses (outcome variables), only including diagnoses significantly associated with CAPE sum scores. We included all items to examine independent associations with diagnoses. We then compared this analysis with a model including current anxiety and depressive symptoms. To account for multiple tests, a Bonferroni corrected alpha value was set at 0.0009.49
Results
Sample Characteristics
29 021 fathers replied to the CAPE-9 questionnaire during the 2015 follow-up. Mean age at CAPE assessment was 42.4 (±5.6) years, 93% were married or cohabiting, 67% had higher education, and 94% were working. Mean SCL-12 sum score was 14.8 (±3.8), and average AUDIT sum score was 3.8 (±2.8, cutoff for problematic drinking in men is 8). Fifteen percent reported lifetime cannabis use, while 2.7% reported cannabis use during the past 6 months. Out of the total sample, 2171 (7.5%) individuals had at least one registered psychiatric diagnosis (2008–2018). Of these, 27 (0.1%) were diagnosed with schizophrenia, 1054 (3.6%) with depressive disorders, 100 (0.3%) with bipolar disorder, 237 (0.8%) with substance abuse disorders, 574 (2%) with anxiety disorders, 45 (0.2%) with obsessive-compulsive disorder, 479 (1.6%) with trauma- and stressor-related disorders, 104 (0.4%) with somatoform disorders, and 180 (0.6%) with ADHD. Supplementary tables S1 and S2 show detailed sample characteristics.
Scale Reliability and Factor Structure
Omega estimates were 0.74 for the CAPE-9 frequency subscale and 0.88 for the distress subscale, indicating adequate to good scale reliability. Scale reliability of SCL-12 was good, with an omega of 0.90. The CAPE-9 frequency subscale showed a good fit with the 3-factor structure observed in CAPE-15; persecutory ideation (items 1, 2, and 3), bizarre thoughts (items 4, 5, 6, and 7), and hallucinations (items 8 and 9) (X2[36] = 2778.1, SRMR = 0.03, RMSEA = 0.008 [90% CI: 0.006–0.010], comparative fit index = 0.98). Item one (Delusions of reference) had the lowest factor loading of 0.37. When removing item one, the percentage of individuals reporting any lifetime PE dropped from 26.1% to 16.2% (n = 4695).
Psychotic Experiences
Table 2 shows detailed lifetime PE response frequencies. Of the total sample, 26.1% (n = 7504) reported having at least one lifetime PE. More individuals reported having occasional persecutory ideation (eg, Beliefs about conspiracy: 26% of total positive responses) compared to bizarre ideas (eg, Electrical influence: 12.1%), or hallucinations (eg, Auditory hallucinations: 5.8%).
Table 2.
Distribution of Psychotic Experiences
| Frequency of Experiences | Associated Distress | |||||||||
|---|---|---|---|---|---|---|---|---|---|---|
| Total | Never | Occasionally | Often | Almost Constantly |
Total | Not at All | A Little | Quite a Lot | A Lot | |
| 1. Delusions of reference | 28 963 | 84% | 15% | 0.4% | 0.1% | 3929 | 82.8% | 16.4% | 0.8% | 0.2% |
| 2. Beliefs about stalking | 28 989 | 96.3% | 3.5% | 0.2% | 0.04% | 1673 | 73.3% | 23.6% | 2.6% | 0.5% |
| 3. Beliefs about conspiracy | 28 970 | 92.9% | 6.7% | 0.2% | 0.1% | 2283 | 53.5% | 40.2% | 5.2% | 1.1% |
| 4. Electrical influence | 28 985 | 96.5% | 3.1% | 0.3% | 0.1% | 1407 | 80.0% | 18.9% | 0.8% | 0.3% |
| 5. Thought insertion | 28 975 | 97.4% | 2.4% | 0.1% | 0.05% | 1352 | 83.6% | 14.1% | 2.3% | 0.1% |
| 6. Thought broadcasting | 28 968 | 96.9% | 2.9% | 0.1% | 0.04% | 1439 | 86.8% | 12.4% | 0.6% | 0.1% |
| 7. External control | 28 979 | 97.5% | 2.3% | 0.2% | 0.1% | 1347 | 83.9% | 13.9% | 1.9% | 0.3% |
| 8. Auditory hallucinations | 28 980 | 98.4% | 1.5% | 0.1% | 0.04% | 1185 | 92.6% | 6.0% | 1.4% | 0.1% |
| 9. Visual hallucinations | 28 972 | 97.9% | 2.0% | 0.1% | 0.05% | 1316 | 92.8% | 6.2% | 0.7% | 0.4% |
Associations Between Lifetime PE and Psychiatric Diagnoses
Those with a psychiatric diagnosis reported more frequent PEs and PE-related distress (d = 0.27, 95% CI = 0.22–0.30; d = 0.53, 95% CI = 0.29–0.71) than those without a diagnosis. Thirty-seven percent of participants with a psychiatric diagnosis reported lifetime PEs (n = 805) compared to 24.9% of participants without a diagnosis (n = 6699).
Figure 1 shows associations between CAPE-9 frequency sum scores and psychiatric diagnoses, with and without adjustments for current anxiety and depressive symptoms. Without adjustments, the frequency sum score was positively associated with schizophrenia (OR = 1.29; 95% CI = 1.19–1.38), depressive disorders (OR = 1.14; 95% CI = 1.10–1.19), bipolar disorder (OR = 1.15; 95% CI = 1.05–1.23), substance abuse (OR = 1.15; 95% CI = 1.08–1.22), anxiety (OR = 1.12; 95% CI = 1.06–1.18), trauma- and stressor-related disorders (OR = 1.14; 95% CI = 1.08–1.20), and ADHD (OR = 1.12; 95% CI = 1.03–1.20). When correcting for current anxiety and depressive symptoms, only the positive association between frequency of PEs and schizophrenia (OR=1.29; 95% CI = 1.18–1.38) and trauma-related disorders (OR = 1.09; 95% CI = 1.02–1.15) remained. supplementary table S3 gives detailed statistical information on associations between PEs and diagnoses.
Fig. 1.

Associations between frequency of PEs and psychiatric diagnoses. Binominal logistic regression model with continuous Community Assessment of Psychic Experiences sum scores (ranging from 9 to 36) and dichotomous diagnoses (yes/no). Analyses with and without adjustments for current anxiety and depressive symptoms as measured with the SCL-12.
Distress sum scores were only significantly associated with schizophrenia (OR = 3.29; 95% CI = 1.85–8.47), and this association increased after adjusting for current anxiety and depressive symptoms (OR = 11.68; 95% CI = 3.22–432.29).
Associations Between Individual Questions and Psychiatric Diagnoses
figure 2 shows the associations between CAPE items and diagnoses, with and without adjustments for anxiety and depressive symptoms. Without adjustments, a schizophrenia diagnosis was only positively associated with beliefs about stalking. Depressive disorders were positively associated with beliefs about conspiracy and thought insertion and negatively associated with electrical influence. Bipolar disorder was positively associated with beliefs about conspiracy and visual hallucinations. Substance abuse was positively associated with thought insertion and beliefs about stalking and conspiracy. Anxiety disorders were positively associated with beliefs about conspiracy and thought insertion. Trauma- and stress-related disorders were positively associated with visual hallucinations and beliefs about stalking and conspiracy.
Fig. 2.
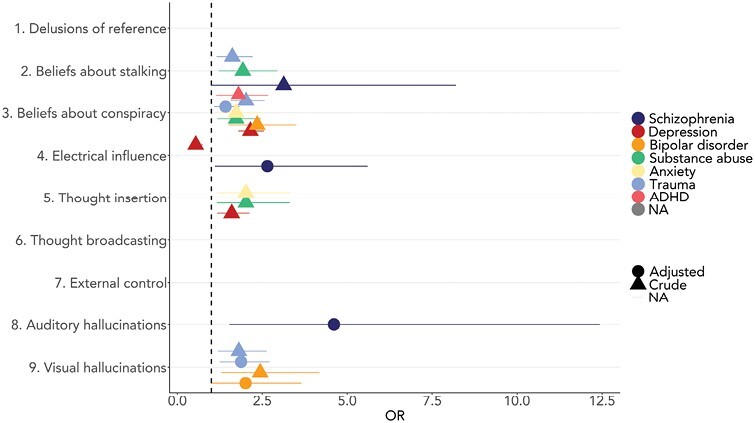
Association between psychiatric diagnoses and CAPE individual frequency items. Binomial logistic regressions with continuous Community Assessment of Psychic Experiences (CAPE) individual item scores and dichotomous diagnoses (yes/no). Only significant associations are presented.
When controlling for current anxiety and depressive symptoms, electrical influence and auditory hallucinations showed strong positive associations with schizophrenia, although the association with electrical influence was at a trend level with the Bonferroni-adjusted alpha. Bipolar disorder now had a positive trend association with visual hallucinations, while trauma- and stress-related disorders were significantly associated with beliefs about conspiracy and visual hallucinations. Supplementary table S4 gives a detailed overview of statistics.
Discussion
The factor structure, scale reliability, and observed distribution of scores support CAPE-9 as a reliable and useful measure of lifetime PEs in the current population-based sample of Norwegian men (n = 29 021). We found statistically significant associations between CAPE-9 frequency scores and both schizophrenia and other—primarily non-psychotic—disorders, whereas distress sum scores were only significantly associated with schizophrenia. After adjusting for current anxiety and depressive symptoms, the CAPE-9 frequency score was only significantly associated with schizophrenia and trauma-related disorders. Taken together, CAPE-9 became more specifically associated with schizophrenia when controlling for concurrent emotional symptoms, although overlapping partially with trauma-related disorders. This supports CAPE-9 as a useful PE instrument. Results also suggest that incorporating a measure of current anxiety and depressive symptoms improves the precision of CAPE-9’s association with psychotic disorders.
The scale reliability of CAPE-9 and SCL-12 was assessed as acceptable to good, but as the distribution of scores is highly skewed, the reliability of CAPE-9 may be underestimated. We found the same 3-factor structure observed for CAPE-15 in previous samples,24,41 strengthening the validity of this previously unvalidated version of CAPE. Moreover, our results support lifetime PEs as relatively common in general populations. Twenty-six percent reported at least one lifetime PE—a higher prevalence than reported by previous meta-analyses based on CAPE and the CIDI (Composite International Diagnostic Interview) psychosis module50 (5.8%2; 7.2%1) – although within the range of reported cross-national prevalence (0.8% to 31.4%15,17,51,52). Although the sample is relatively healthy and well-educated, there may be several reasons why a high percentage still reports lifetime PEs. Firstly, the Norwegian version of CAPE-9 includes a prompt stating that such experiences “may be more common than you think” (see table 1), which may increase positive responses by reducing stigma. Noticeably, this prompt is also present in the Swedish version of CAPE-4253 but not the English version.54 Secondly, responses to specific questions could be overinflated. Particularly, delusions of reference did not sufficiently load on any PE factors and had the most positive responses, suggesting an inflated response rate, which may result from participants misinterpreting the question. The number of reported PEs remained comparatively high when we removed this item (26.1% to 16.5%). Additionally, removing the item did not significantly affect any observed associations. Improved large-scale assessment of symptoms can lead to detection of vulnerable individuals and improve our understanding of the dimensionality of psychosis. For this, we need cheap and easy-to-use instruments. Overall, our findings support CAPE-9 as a short and cost-effective measure of PEs, with reliability and structure comparable to longer versions of CAPE.
As hypothesized, most psychiatric diagnoses were positively associated with frequency of lifetime PEs, with the largest effect on schizophrenia. These findings align with the idea that PEs occur more frequently in most mental disorders.10,55 Nevertheless, when adjusting for ongoing anxiety and depressive symptoms, only associations with schizophrenia and trauma-related disorders remained. There may be several explanations for these observations. First, PEs and emotional symptoms likely share common causes, such as stressful life events, social adversity, and genetic vulnerability.56–61 Hence, transdiagnostic PEs may occur as indirect markers of these shared causal factors. Controlling for anxiety and depressive symptoms would then buffer the association between PEs and diagnosed non-psychotic disorders without emotional symptoms directly causing PEs. Second, questions about paranoia could capture real-life experiences of stalking and harassment, thereby explaining the strong link between frequency of PEs and trauma-related disorders. Finally, concurrent anxiety and depressive symptoms may lead to inflated reports of lifetime PEs, resulting in overestimated associations between PEs and non-psychotic disorders. Overall, the relationship between lifetime PEs, current emotional states, and psychiatric diagnoses is likely multifaceted. Further research is needed to explore the directionality of these associations.
Short-form PE measures, like CAPE-9 and the CIDI psychosis module,50 do not include questions on emotional symptoms. These measures are designed to be time-effective, while capturing experiences most closely related to psychotic disorders and are, thus, believed to capture mainly psychotic symptomatology. The current findings suggest that self-reported lifetime PE measures may also capture current anxiety and depressive symptoms in population samples. If so, screening using short instruments may more accurately detect psychotic symptomatology when combined with affective symptom measures. Adjusting for anxiety and depressive symptoms may also improve estimates of the relationship between PEs and outcomes of interest. Furthermore, as beliefs about stalking, conspiracy, and thought insertion were associated with primarily non-psychotic disorders, these items may capture symptoms that are nonspecific to psychotic illness. Beliefs about stalking and conspiracy relate to paranoia and hypervigilance, while thought insertion may capture intrusive thoughts, which are frequent in non-psychotic diagnoses.62–66 However, we did not compare our results, based on self-report measures, to clinician-rated interviews. Therefore, we cannot conclude that current emotional states directly lead individuals to overestimate reports of lifetime PEs or conclude on the directionality of effect between PEs, emotional symptoms, and psychiatric diagnoses. Future studies comparing self- and interview-reported PEs are needed to directly test the relationship between current emotional status and self-reported PEs.
This study has several methodological strengths, including its large sample size, making it one of the most extensive studies of PEs yet. Linkage to patient registries also allows for accurate diagnostic data. This is one of few studies to investigate the relationship between specific PE and both psychotic and non-psychotic disorders. While previous studies have chiefly investigated associations between PEs and outcome variables, we wanted to explore how other mental health symptoms may influence this relationship, thereby pursuing a deeper understanding of how PEs operate in general populations.
Several limitations must be considered. First, a cross-sectional design is susceptible to potential bias and does not allow for causal inference. Second, it is difficult to disentangle PEs from other psychological phenomena not measured.18 A significant limitation in CAPE is the absence of questions probing whether self-reported experiences were probable or related to substance use, sleep states, or medical conditions. Future studies including this information are warranted. Additionally, self-reported prevalence of PEs is up to 3 times higher than that of clinical assessments.1 However, associations between PEs and variables of interest are usually comparable.51 In large cohort studies, cost-effective data collection is necessary, and despite being a short self-report instrument, our psychometric investigations support CAPE-9 as valid and useful.
The current sample is reasonably homogenous, consisting of mostly Scandinavian, middle-aged fathers, which may reduce error variance but also makes results less generalizable. Future research should consider factors related to nationality, age, and gender that may affect the occurrence of PEs differently. For instance, while a previous study reported higher prevalence of PEs in women,2 a more recent study found no differences in overall prevalence between adolescent boys and girls.67 Previous MoBa studies also note selection bias due to loss of follow-up.68–70 Overall, younger individuals with low socioeconomic status and mental health problems are underrepresented. Compared to baseline, the follow-up sample had fewer psychiatric diagnoses (9.6% vs. 7.5%). This bias could result in an underestimation of PE’s association with diagnoses. Moreover, schizophrenia is usually diagnosed in early adulthood, and individuals with schizophrenia are less likely to get married and have children.71,72 This is mirrored in the current sample of fathers where the frequency of schizophrenia is low (~0.1%) compared to prevalence in general populations (~0.2%–0.4%).73 However, we have little reason to assume that the relationship between PEs and diagnoses is different in our sample versus the target population. It should be noted that our analyses are based on specialist healthcare diagnoses, encompassing mostly moderate to severe disorders. PEs may be less prevalent in milder forms of mental illness. To explore the association between PEs and milder forms of mental illness, future research may include primary healthcare diagnoses.
Conclusion
In summary, we find that CAPE-9 is a reliable and effective tool for measuring lifetime PEs in a large population-based male sample. A substantial part of participants reports PEs regardless of having a psychiatric diagnosis or not. Results show that CAPE-9 scores are associated with multiple mental disorders and that controlling for current anxiety and depressive symptoms enhanced the precision of associations with psychotic disorders. These findings carry important implications for public health initiatives and can help our understanding of the dimensionality of psychosis. Overall, CAPE-9 has the potential to advance research and public health initiatives by providing time- and cost-effective assessment of PE in the general population.
Supplementary Material
Acknowledgments
We are grateful to all the families who participate in MoBa. MoBa is supported by the Norwegian Ministry of Health and Care Services and the Ministry of Education and Research. This work was performed on Services for sensitive data (TSD), University of Oslo, Norway, with resources from UNINETT Sigma2—the National Infrastructure for High-Performance Computing and Data Storage in Norway. We want to thank Prof. Jim van Os for counseling during implementation of CAPE in MoBa.
Contributor Information
Viktoria Birkenæs, NORMENT, KG Jebsen Centre for Psychosis Research, Department of Mental Health and Addiction, Oslo University Hospital, and Institute of Clinical Medicine, University of Oslo, Oslo, Norway.
Nora Refsum Bakken, NORMENT, KG Jebsen Centre for Psychosis Research, Department of Mental Health and Addiction, Oslo University Hospital, and Institute of Clinical Medicine, University of Oslo, Oslo, Norway.
Evgeniia Frei, NORMENT, KG Jebsen Centre for Psychosis Research, Department of Mental Health and Addiction, Oslo University Hospital, and Institute of Clinical Medicine, University of Oslo, Oslo, Norway.
Piotr Jaholkowski, NORMENT, KG Jebsen Centre for Psychosis Research, Department of Mental Health and Addiction, Oslo University Hospital, and Institute of Clinical Medicine, University of Oslo, Oslo, Norway.
Olav B Smeland, NORMENT, KG Jebsen Centre for Psychosis Research, Department of Mental Health and Addiction, Oslo University Hospital, and Institute of Clinical Medicine, University of Oslo, Oslo, Norway.
Markos Tesfaye, NORMENT, KG Jebsen Centre for Psychosis Research, Department of Mental Health and Addiction, Oslo University Hospital, and Institute of Clinical Medicine, University of Oslo, Oslo, Norway.
Ingrid Agartz, NORMENT, KG Jebsen Centre for Psychosis Research, Department of Mental Health and Addiction, Oslo University Hospital, and Institute of Clinical Medicine, University of Oslo, Oslo, Norway; KG Jebsen Centre for Neurodevelopmental Disorders, University of Oslo, Oslo, Norway; Department of Psychiatric Research, Diakohjemmet Hospital, Oslo, Norway.
Ezra Susser, Mailman School of Public Health, Department of Epidemiology and Psychiatry, Columbia University, New York, NY, USA; New York State Psychiatric Institute, New York, NY, USA.
Michaeline Bresnahan, Mailman School of Public Health, Department of Epidemiology and Psychiatry, Columbia University, New York, NY, USA; New York State Psychiatric Institute, New York, NY, USA.
Espen Røysamb, Faculty of Social Sciences, Department of Psychology, Oslo University Hospital, Oslo, Norway.
Kjetil Nordbø Jørgensen, NORMENT, KG Jebsen Centre for Psychosis Research, Department of Mental Health and Addiction, Oslo University Hospital, and Institute of Clinical Medicine, University of Oslo, Oslo, Norway.
Ragnar Nesvåg, Division of Mental and Physical Health, Norwegian Institute of Public Health, Oslo, Norway.
Alexandra Havdahl, Center for Genetic Epidemiology and Mental Health, Norwegian Institute of Public Health, Oslo, Norway; Nic Waals Institute, Lovisenberg Diaconal Hospital, Oslo, Norway; PROMENTA Research Center, Department of Psychology, University of Oslo, Oslo, Norway.
Ole A Andreassen, NORMENT, KG Jebsen Centre for Psychosis Research, Department of Mental Health and Addiction, Oslo University Hospital, and Institute of Clinical Medicine, University of Oslo, Oslo, Norway; KG Jebsen Centre for Neurodevelopmental Disorders, University of Oslo, Oslo, Norway.
Ida Elken Sønderby, NORMENT, KG Jebsen Centre for Psychosis Research, Department of Mental Health and Addiction, Oslo University Hospital, and Institute of Clinical Medicine, University of Oslo, Oslo, Norway; KG Jebsen Centre for Neurodevelopmental Disorders, University of Oslo, Oslo, Norway; Department of Medical Genetics, Oslo University Hospital, Oslo, Norway.
Funding
This project received funding from the European Union’s Horizon 2020 Research and Innovation Programme (RealMent; #964874, CoMorMent project; Grant #847776), the Research Council of Norway (#223273, #271555, and #274611), the South–Eastern Norway Regional Health Authority (#2020060 and #2020022), and Kristian Gerhard Jebsen Stiftelsen (SKGJ-MED-021).
Conflicts of Interest
OA is a consultant to Cortechs.ai. OA and IA received speaker’s honoraria from Lundbeck and Sunovion. None of the remaining authors have any conflicts of interest.
References
- 1. Linscott RJ, Van Os J.. An updated and conservative systematic review and meta-analysis of epidemiological evidence on psychotic experiences in children and adults: on the pathway from proneness to persistence to dimensional expression across mental disorders. Psychol Med. 2013;43(6):1133–1149. doi: 10.1017/S0033291712001626 [DOI] [PubMed] [Google Scholar]
- 2. McGrath JJ, Saha S, Al-Hamzawi A, et al. Psychotic experiences in the general population: a cross-national analysis based on 31 261 respondents from 18 countries. JAMA Psychiatry. 2015;72(7):697–705. doi: 10.1001/jamapsychiatry.2015.0575 [DOI] [PMC free article] [PubMed] [Google Scholar]
- 3. Guloksuz S, Pries LK, ten Have M, et al. Association of preceding psychosis risk states and non-psychotic mental disorders with incidence of clinical psychosis in the general population: a prospective study in the NEMESIS-2 cohort. World Psychiatry. 2020;19(2):199–205. doi: 10.1002/wps.20755 [DOI] [PMC free article] [PubMed] [Google Scholar]
- 4. Kaymaz N, Drukker M, Lieb R, et al. Do subthreshold psychotic experiences predict clinical outcomes in unselected non-help-seeking population-based samples? A systematic review and meta-analysis, enriched with new results. Psychol Med. 2012;42(11):2239–2253. doi: 10.1017/S0033291711002911 [DOI] [PubMed] [Google Scholar]
- 5. Werbeloff N, Drukker M, Dohrenwend BP, et al. Self-reported attenuated psychotic symptoms as forerunners of severe mental disorders later in life. Arch Gen Psychiatry. 2012;69(5):467–475. doi: 10.1001/archgenpsychiatry.2011.1580 [DOI] [PubMed] [Google Scholar]
- 6. Moreno-Küstner B, Martín C, Pastor L.. Prevalence of psychotic disorders and its association with methodological issues. A systematic review and meta-analyses. PLoS One. 2018;13(4):e0195687. doi: 10.1371/journal.pone.0195687 [DOI] [PMC free article] [PubMed] [Google Scholar]
- 7. Yates K, Lång U, Peters EM, et al. Hallucinations in the general population across the adult lifespan: prevalence and psychopathologic significance. Br J Psychiatry. 2021;219(6):652–658. doi: 10.1192/bjp.2021.100 [DOI] [PubMed] [Google Scholar]
- 8. Coid JW, Zhang Y, Zeng J, et al. Testing extra-linearity across a psychosis continuum. BMC Psychiatry. 2021;21(1):1–15. doi: 10.1186/s12888-021-03498-3 [DOI] [PMC free article] [PubMed] [Google Scholar]
- 9. van Os J, Hanssen M, Bijl R, Ravelli A; Strauss. revisited: a psychosis continuum in the general population? Schizophr Res. 19692000;45(1–2):11–20. doi: 10.1016/S0920-9964(99)00224-8. [DOI] [PubMed] [Google Scholar]
- 10. Van Os J. The many continua of psychosis. JAMA Psychiatry. 2014;71(9):985. doi: 10.1001/jamapsychiatry.2014.1068 [DOI] [PubMed] [Google Scholar]
- 11. Kırlı U, Binbay T, Drukker M, et al. Psychotic experiences and mood episodes predict each other bidirectionally: a 6-year follow-up study in a community-based population. Soc Psychiatry Psychiatr Epidemiol. 2019;54(3):331–341. doi: 10.1007/s00127-018-1641-8 [DOI] [PubMed] [Google Scholar]
- 12. McGrath JJ, Saha S, Al-Hamzawi A, et al. The bidirectional associations between psychotic experiences and DSM-IV mental disorders. Am J Psychiatry. 2016;173(10):997–1006. doi: 10.1176/appi.ajp.2016.15101293 [DOI] [PMC free article] [PubMed] [Google Scholar]
- 13. Bhavsar V, Dorrington S, Morgan C, et al. Psychotic experiences, psychiatric comorbidity and mental health need in the general population: a cross-sectional and cohort study in Southeast London. Psychol Med. 2021;51(1):147–157. doi: 10.1017/S0033291719003106 [DOI] [PMC free article] [PubMed] [Google Scholar]
- 14. Rössler W, Riecher-Rössler A, Angst J, et al. Psychotic experiences in the general population: a twenty-year prospective community study. Schizophr Res. 2007;92(1–3):1–14. doi: 10.1016/j.schres.2007.01.002 [DOI] [PubMed] [Google Scholar]
- 15. Navarro-Mateu F, Alonso J, Lim CCW, et al. The association between psychotic experiences and disability: results from the WHO World Mental Health Surveys. Acta Psychiatr Scand. 2017;136(1):74–84. doi: 10.1111/acps.12749. [DOI] [PMC free article] [PubMed] [Google Scholar]
- 16. Oh H, Koyanagi A, Kelleher I, DeVylder J.. Psychotic experiences and disability: findings from the collaborative psychiatric epidemiology surveys. Schizophr Res. 2018;193:343–347. doi: 10.1016/j.schres.2017.07.049 [DOI] [PMC free article] [PubMed] [Google Scholar]
- 17. Nuevo R, Chatterji S, Verdes E, Naidoo N, Arango C, Ayuso-Mateos JL.. The continuum of psychotic symptoms in the general population: a cross-national study. Schizophr Bull. 2012;38(3):475–485. doi: 10.1093/schbul/sbq099 [DOI] [PMC free article] [PubMed] [Google Scholar]
- 18. Hanssen M, Peeters F, Krabbendam L, Radstake S, Verdoux H, van Os J.. How psychotic are individuals with non-psychotic disorders? Soc Psychiatry Psychiatr Epidemiol. 2003;38(3):149–154. doi: 10.1007/s00127-003-0622-7 [DOI] [PubMed] [Google Scholar]
- 19. Konings M, Bak M, Hanssen M, van Os J, Krabbendam L.. Validity and reliability of the CAPE: a self-report instrument for the measurement of psychotic experiences in the general population. Acta Psychiatr Scand. 2006;114(1):55–61. doi: 10.1111/j.1600-0447.2005.00741.x [DOI] [PubMed] [Google Scholar]
- 20. Pignon B, Peyre H, Ferchiou A, et al. ; EU-GEI WP2 Group Author. Assessing cross-national invariance of the Community Assessment of Psychic Experiences (CAPE). Psychol Med. 2019;49(15):2600–2607. doi: 10.1017/S0033291718003574 [DOI] [PubMed] [Google Scholar]
- 21. Welham J, Scott J, Williams G, et al. Emotional and behavioural antecedents of young adults who screen positive for non-affective psychosis: a 21-year birth cohort study. Psychol Med. 2009;39(4):625–634. doi: 10.1017/S0033291708003760. [DOI] [PubMed] [Google Scholar]
- 22. Jaya ES, van Amelsvoort T, Bartels-Velthuis AA, et al. The community assessment of psychic experiences: optimal cut-off scores for detecting individuals with a psychotic disorder. Int J Methods Psychiatr Res. 2021;30(4):e1893. doi: 10.1002/MPR.1893. [DOI] [PMC free article] [PubMed] [Google Scholar]
- 23. Capra C, Kavanagh DJ, Hides L, Scott J.. Brief screening for psychosis-like experiences. Schizophr Res. 2013;149(1-3):104–107. doi: 10.1016/j.schres.2013.05.020. [DOI] [PubMed] [Google Scholar]
- 24. Capra C, Kavanagh DJ, Hides L, Scott JG.. Current CAPE-15: a measure of recent psychotic-like experiences and associated distress. Early Interv Psychiatry. 2017;11(5):411–417. doi: 10.1111/eip.12245. [DOI] [PubMed] [Google Scholar]
- 25. Hanssen M, Bak M, Bijl R, Vollebergh W, van Os J.. The incidence and outcome of subclinical psychotic experiences in the general population. Br J Clin Psychol. 2005;44(2):181–191. doi: 10.1348/014466505X29611. [DOI] [PubMed] [Google Scholar]
- 26. Kelleher I, Keeley H, Corcoran P, et al. Clinicopathological significance of psychotic experiences in non-psychotic young people: evidence from four population-based studies. Br J Psychiatry. 2012;201(1):26–32. doi: 10.1192/bjp.bp.111.101543 [DOI] [PubMed] [Google Scholar]
- 27. Gorman JM. Comorbid depression and anxiety spectrum disorders. Depress Anxiety. 1996;4(4):160–168. doi: [DOI] [PubMed] [Google Scholar]
- 28. Kessler RC, McGonagle KA, Zhao S, et al. Lifetime and 12-month prevalence of DSM-III-R psychiatric disorders in the United States: results from the national comorbidity survey. Arch Gen Psychiatry. 1994;51(1):8–19. doi: 10.1001/archpsyc.1994.03950010008002 [DOI] [PubMed] [Google Scholar]
- 29. Liu Q, Wangqing P, Baima Y, et al. Comorbid depressive and anxiety symptoms and their correlates among 93,078 multiethnic adults in southwest China. Front Public Health. 2021;9:2296–2565. doi: 10.3389/fpubh.2021.783687 [DOI] [PMC free article] [PubMed] [Google Scholar]
- 30. Wigman JTW, Vollebergh WAM, Raaijmakers QAW, et al. The structure of the extended psychosis phenotype in early adolescence - A cross-sample replication. Schizophr Bull. 2011;37(4):850–860. doi: 10.1093/schbul/sbp154 [DOI] [PMC free article] [PubMed] [Google Scholar]
- 31. Armando M, Nelson B, Yung AR, et al. Psychotic-like experiences and correlation with distress and depressive symptoms in a community sample of adolescents and young adults. Schizophr Res. 2010;119(1–3):258–265. doi: 10.1016/j.schres.2010.03.001 [DOI] [PubMed] [Google Scholar]
- 32. Armando M, Lin A, Girardi P, et al. Prevalence of psychotic-like experiences in young adults with social anxiety disorder and correlation with affective dysregulation. J Nerv Ment Dis. 2013;201(12):1053–1059. doi: 10.1097/NMD.0000000000000050 [DOI] [PubMed] [Google Scholar]
- 33. Peters E, Ward T, Jackson M, et al. Clinical relevance of appraisals of persistent psychotic experiences in people with and without a need for care: an experimental study. Lancet Psychiatry. 2017;4(12):927–936. doi: 10.1016/S2215-0366(17)30409-1 [DOI] [PMC free article] [PubMed] [Google Scholar]
- 34. Ward TA, Gaynor KJ, Hunter MD, Woodruff PWR, Garety PA, Peters ER.. Appraisals and responses to experimental symptom analogues in clinical and nonclinical individuals with psychotic experiences. Schizophr Bull. 2014;40(4):845–855. doi: 10.1093/schbul/sbt094 [DOI] [PMC free article] [PubMed] [Google Scholar]
- 35. Naicker SN, Norris SA, Richter LM.. Secondary analysis of retrospective and prospective reports of adverse childhood experiences and mental health in young adulthood: filtered through recent stressors. EClinicalMedicine. 2021;40:101094. doi: 10.1016/j.eclinm.2021.101094 [DOI] [PMC free article] [PubMed] [Google Scholar]
- 36. Baldwin JR, Reuben A, Newbury JB, Danese A.. Agreement between prospective and retrospective measures of childhood maltreatment: a systematic review and meta-analysis. JAMA Psychiatry. 2019;76(6):584. doi: 10.1001/jamapsychiatry.2019.0097 [DOI] [PMC free article] [PubMed] [Google Scholar]
- 37. van den Bergh O, Walentynowicz M.. Accuracy and bias in retrospective symptom reporting. Curr Opin Psychiatry. 2016;29(5):302–308. doi: 10.1097/YCO.0000000000000267 [DOI] [PubMed] [Google Scholar]
- 38. Magnus P, Birke C, Vejrup K, et al. Cohort profile update: the norwegian mother and child cohort study (MoBa). Int J Epidemiol. 2016;45(2):382–388. doi: 10.1093/ije/dyw029 [DOI] [PubMed] [Google Scholar]
- 39. Magnus P, Irgens LM, Haug K, Nystad W, Skjaerven R, Stoltenberg C; MoBa Study Group. Cohort profile: the norwegian mother and child cohort study (MoBa). Int J Epidemiol. 2006;35(5):1146–1150. doi: 10.1093/ije/dyl170 [DOI] [PubMed] [Google Scholar]
- 40. World Health Organization. ICD-10: international statistical classification of diseases and related health problems: tenth revision, 2nd ed. World Health Organization. Radiol Manage. 2004;33(3). [Google Scholar]
- 41. Mark W, Toulopoulou T.. Psychometric properties of “community assessment of psychic experiences”: review and meta-analyses. Schizophr Bull. 2016;42(1):34–44. doi: 10.1093/schbul/sbv088. [DOI] [PMC free article] [PubMed] [Google Scholar]
- 42. Derogatis LR, Lipman RS, Covi L.. SCL-90: an outpatient psychiatric rating scale--preliminary report. Psychopharmacol Bull. 1973;9(1):13–28. [PubMed] [Google Scholar]
- 43. Tambs K, Moum T.. How well can a few questionnaire items indicate anxiety and depression? Acta Psychiatr Scand. 1993;87(5):364–367. doi: 10.1111/j.1600-0447.1993.tb03388.x [DOI] [PubMed] [Google Scholar]
- 44. Tambs K, Røysamb E.. Selection of questions to short-form versions of original psychometric instruments in MoBa. Norsk Epidemiologi. 2014;24(1–2):195–201. doi: 10.5324/nje.v24i1-2.1822. [DOI] [Google Scholar]
- 45. Saunders JB, Babor TF.. AUDIT questionnaire: screen for alcohol misuse. Addiction. 1993;88(791–803). [Google Scholar]
- 46. McNeish D. Thanks coefficient alpha, We’ll take it from here. Psychol Methods. 2018;23(3):412–433. doi: 10.1037/met0000144. [DOI] [PubMed] [Google Scholar]
- 47. Rosseel YL. Lavaan: An R package for structural equation modeling. J Stat Softw. 2012;48:1–36. doi: 10.18637/jss.v048.i02 [DOI] [Google Scholar]
- 48. Hu LT, Bentler PM.. Cutoff criteria for fit indexes in covariance structure analysis: conventional criteria versus new alternatives. Struct Equ Modeling. 1999;6(1):1–55. doi: 10.1080/10705519909540118. [DOI] [Google Scholar]
- 49. Sedgwick P. Multiple significance tests: the Bonferroni correction. BMJ. 2012;344(7841). doi: 10.1136/bmj.e509. [DOI] [Google Scholar]
- 50. Kessler RC, Üstün BB.. The World Mental Health (WMH) Survey Initiative version of the World Health Organization (WHO) Composite International Diagnostic Interview (CIDI). Int J Methods Psychiatr Res. 2004;13(2):93–121. doi: 10.1002/mpr.168. [DOI] [PMC free article] [PubMed] [Google Scholar]
- 51. Monshouwer K, Ten Have M, Tuithof M, et al. Prevalence, incidence, and persistence of psychotic experiences in the general population: results of a 9-year follow-up study. Psychol Med. 2022;1–12. doi: 10.1017/S0033291722002690 [DOI] [PubMed] [Google Scholar]
- 52. Nesvåg R, Reichborn-Kjennerud T, Gillespie NA, et al. Genetic and environmental contributions to the association between cannabis use and psychotic-like experiences in young adult twins. Schizophr Bull. 2017;43(3):644–653. doi: 10.1093/schbul/sbw101 [DOI] [PMC free article] [PubMed] [Google Scholar]
- 53. Therman S, Suvisaari J, Hultman CM.. Dimensions of psychotic experiences among women in the general population. Int J Methods Psychiatr Res. 2014;23(1):62–68. doi: 10.1002/mpr.1427 [DOI] [PMC free article] [PubMed] [Google Scholar]
- 54. Stefanis NC, Hanssen M, Smirnis NK, et al. Evidence that three dimensions of psychosis have a distribution in the general population. Psychol Med. 2002;32:347–358. doi: 10.1017/S0033291701005141. [DOI] [PubMed] [Google Scholar]
- 55. Saha SG, Scott J, Varghese D, McGrath J.. The association between general psychological distress and delusional-like experiences: a large population-based study. Schizophr Res. 2011;127(1–3). doi: 10.1016/j.schres.2010.12.012 [DOI] [PubMed] [Google Scholar]
- 56. Sieradzka D, Power RA, Freeman D, et al. Are genetic risk factors for psychosis also associated with dimension-specific psychotic experiences in adolescence? PLoS One. 2014;9(4):e94398. doi: 10.1371/journal.pone.0094398 [DOI] [PMC free article] [PubMed] [Google Scholar]
- 57. Wainberg M, Jacobs GR, di Forti M, Tripathy SJ.. Cannabis, schizophrenia genetic risk, and psychotic experiences: a cross-sectional study of 109,308 participants from the UK Biobank. Transl Psychiatry. 2021;11(1):211. doi: 10.1038/s41398-021-01330-w [DOI] [PMC free article] [PubMed] [Google Scholar]
- 58. Nishida A, Shimodera S, Sasaki T, et al. Risk for suicidal problems in poor-help-seeking adolescents with psychotic-like experiences: findings from a cross-sectional survey of 16,131 adolescents. Schizophr Res. 2014;159(2–3):257–262. doi: 10.1016/j.schres.2014.09.030 [DOI] [PubMed] [Google Scholar]
- 59. Van Os J, Pries LK, Ten Have M, et al. Evidence, and replication thereof, that molecular-genetic and environmental risks for psychosis impact through an affective pathway. Psychol Med. 2022;52(10):1910–1922. doi: 10.1017/S0033291720003748 [DOI] [PubMed] [Google Scholar]
- 60. Radhakrishnan R, Guloksuz S, Ten Have M, et al. Interaction between environmental and familial affective risk impacts psychosis admixture in states of affective dysregulation. Psychol Med. 2019;49(11):1910–1003. doi: 10.1017/S0033291718002635 [DOI] [PubMed] [Google Scholar]
- 61. Moore TH, Zammit S, Lingford-Hughes A, et al. Cannabis use and risk of psychotic or affective mental health outcomes: a systematic review. Lancet. 2007;370(9584):319–328. doi: 10.1016/S0140-6736(07)61162-3. [DOI] [PubMed] [Google Scholar]
- 62. van den Heuvel OA, Veale D, Stein DJ.. Hypochondriasis: considerations for ICD-11. Rev Bras Psiquiatr. 2014;36:21–27. doi: 10.1590/1516-4446-2013-1218 [DOI] [PubMed] [Google Scholar]
- 63. Wiggs CL, Martin A, Altemus M, Murphy DL.. Hypervigilance in patients with obsessive-compulsive disorder. Anxiety. 1996;2(3):123–129. doi: [DOI] [PubMed] [Google Scholar]
- 64. Gootzeit J, Markon K.. Factors of PTSD: Differential specificity and external correlates. Clin Psychol Rev. 2011;31(6):993–1003. doi: 10.1016/j.cpr.2011.06.005 [DOI] [PubMed] [Google Scholar]
- 65. Maremmani AGI, Rovai L, Rugani F, Bacciardi S, Dell’osso L, Maremmani I.. Substance abuse and psychosis. The strange case of opioids. Eur Rev Med Pharmacol Sci. 2014;18(3):287–302. [PubMed] [Google Scholar]
- 66. Bloch HS. The common core of paranoia and depression. Psychoanal Inq. 1989;9(3):427–449. doi: 10.1080/07351698909533776 [DOI] [Google Scholar]
- 67. Wu Z, Liu D, Zhang J, et al. Sex difference in the prevalence of psychotic-like experiences in adolescents: results from a pooled study of 21,248 Chinese participants. Psychiatry Res. 2022;317:114894. doi: 10.1016/j.psychres.2022.114894 [DOI] [PubMed] [Google Scholar]
- 68. Vejrup K, Magnus P, Magnus M.. Lost to follow-up in the Norwegian mother, father and child cohort study. Paediatr Perinat Epidemiol. 2022;36(2):300–309. doi: 10.1111/ppe.12821 [DOI] [PubMed] [Google Scholar]
- 69. Nilsen RM, Vollset SE, Gjessing HK, et al. Self-selection and bias in a large prospective pregnancy cohort in Norway. Paediatr Perinat Epidemiol. 2009;23(6):597–608. doi: 10.1111/j.1365-3016.2009.01062.x [DOI] [PubMed] [Google Scholar]
- 70. Biele G, Gustavson K, Czajkowski NO, et al. Bias from self selection and loss to follow-up in prospective cohort studies. Eur J Epidemiol. 2019;34(10):927–938. doi: 10.1007/s10654-019-00550-1 [DOI] [PubMed] [Google Scholar]
- 71. Agerbo E, Byrne M, Eaton WW, Mortensen PB.. Marital and labor market status in the long run in schizophrenia. Arch Gen Psychiatry. 2004;61(1):28–33. doi: 10.1001/archpsyc.61.1.28 [DOI] [PubMed] [Google Scholar]
- 72. Bundy H, Stahl D, MacCabe JH.. A systematic review and meta-analysis of the fertility of patients with schizophrenia and their unaffected relatives. Acta Psychiatr Scand. 2011;123(2):98–106. doi: 10.1111/j.1600-0447.2010.01623.x [DOI] [PubMed] [Google Scholar]
- 73. Saha S, Chant D, Welham J, McGrath J.. A systematic review of the prevalence of schizophrenia. PLoS Med. 2005;2(5):e141. doi: 10.1371/journal.pmed.0020141 [DOI] [PMC free article] [PubMed] [Google Scholar]
Associated Data
This section collects any data citations, data availability statements, or supplementary materials included in this article.