
FIGURE 2.
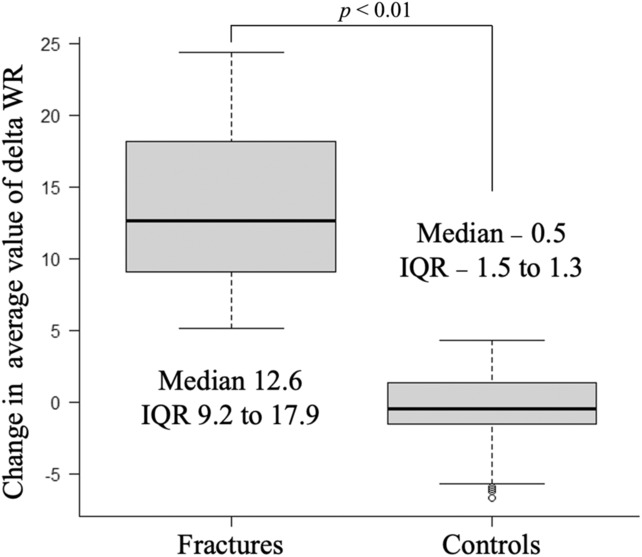
Comparison of wedging ratio between control and fracture images. This analysis shows a significant difference between the controls and fractures. IQR, interquartile range; WR, wedging ratio.
Official websites use .gov
A
.gov website belongs to an official
government organization in the United States.
Secure .gov websites use HTTPS
A lock (
) or https:// means you've safely
connected to the .gov website. Share sensitive
information only on official, secure websites.
Comparison of wedging ratio between control and fracture images. This analysis shows a significant difference between the controls and fractures. IQR, interquartile range; WR, wedging ratio.