Figure 2.

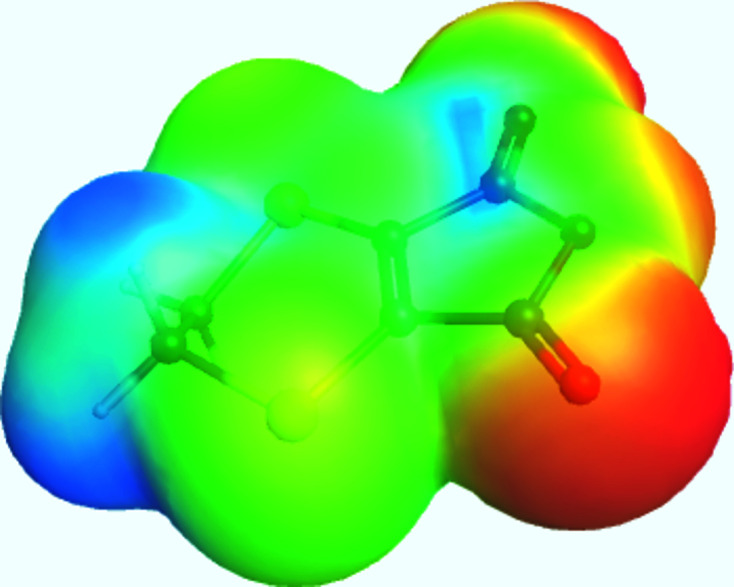
Electrostatic potential plot of the title molecule with the optimized geometry visible. Red represents the most negatively charged regions, while blue represents the most positively charged.

Electrostatic potential plot of the title molecule with the optimized geometry visible. Red represents the most negatively charged regions, while blue represents the most positively charged.