Fig. 1.

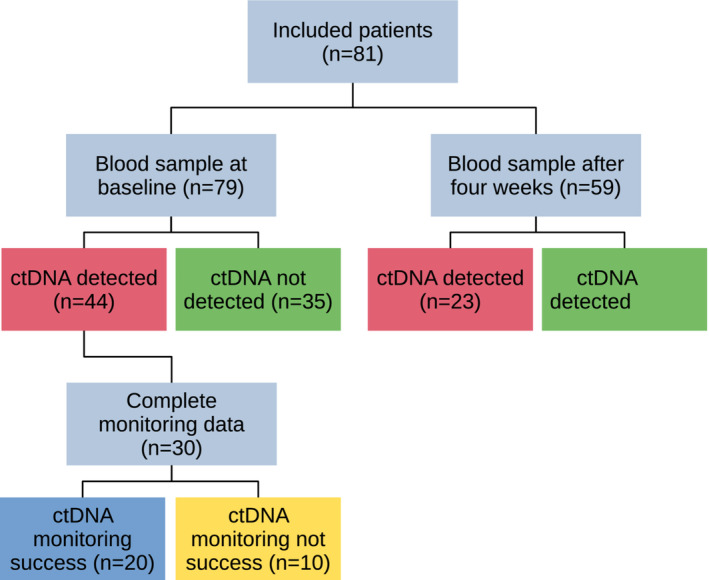
Patient flow diagram showing the number of patients included and the main results of ctDNA measurements in the various parts of the study.

Patient flow diagram showing the number of patients included and the main results of ctDNA measurements in the various parts of the study.