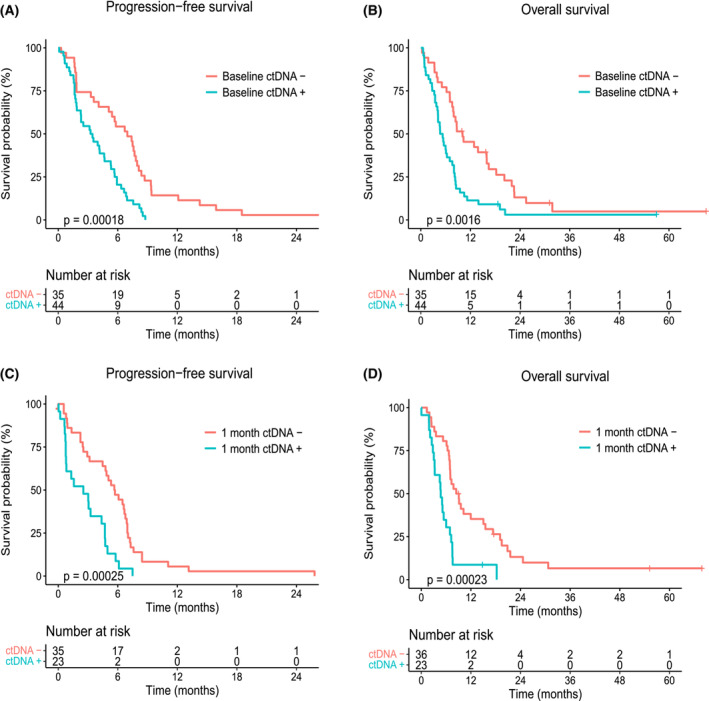
Fig. 2.

Kaplan–Meier survival estimates according to ctDNA detection. (A) Progression‐free survival (PFS) according to baseline ctDNA detection (Baseline ctDNA + or −). (B) Overall survival (OS) according to baseline ctDNA detection (Baseline ctDNA + or −). (C) PFS according to ctDNA detection after 1 month of chemotherapy (1 month ctDNA + or −). (D) OS according to ctDNA detection after 1 month of chemotherapy (1 month ctDNA + or −). One patient experienced disease progression before the second sample collection, and was therefore only included in the analysis of OS (D). Censored patients are indicated by plus symbols (+) on the survival estimate curves. P‐values correspond to log‐rank tests for survival differences.
