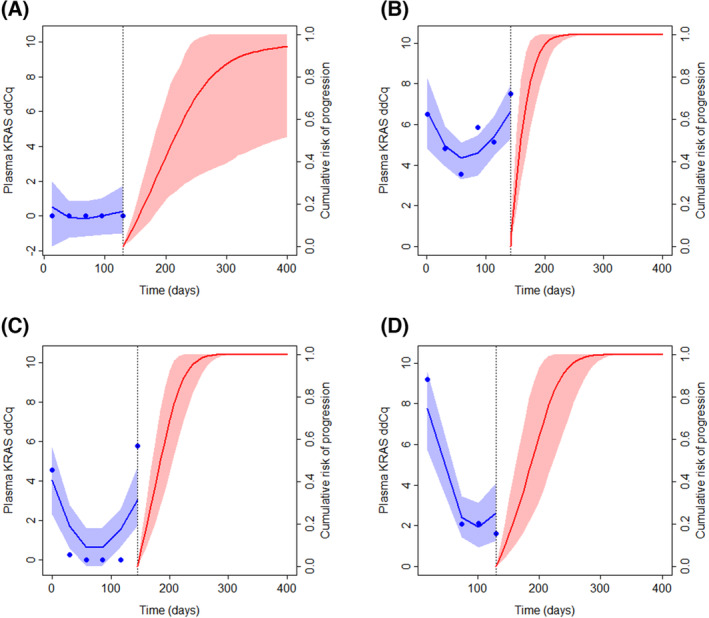
Fig. 3.

Dynamic prediction of first progression for select patients. The left‐hand side of the plots shows the observed and fitted longitudinal trajectory of ctDNA level (plasma KRAS ddCq) from baseline to approximately 140 days; the right‐hand side shows the predicted cumulative risk of progression from the time of the last included plasma KRAS ddCq observation. (A) 72‐year‐old woman from Stavanger University Hospital (SUH) with liver metastases, Eastern Cooperative Oncology Group performance status (ECOG PS) = 0, first‐line medication FOLFIRINOX, time of first progression 284 days. (B) 51‐year‐old woman from SUH with liver metastases, ECOG PS = 1, first‐line medication nab‐paclitaxel/gemcitabine, time of first progression 162 days. (C) 72‐year‐old woman from SUH with liver metastases, ECOG PS = 1, first‐line medication nab‐paclitaxel/gemcitabine, time of first progression 173 days. (D) 52‐year‐old man from Haukeland University Hospital (HUH) with liver metastases, ECOG PS = 1, first‐line medication FOLFIRINOX, time of first progression 249 days. Animations of the developing dynamic predictions over time are shown in Animations [Link], [Link] (corresponding to panels A–D).
