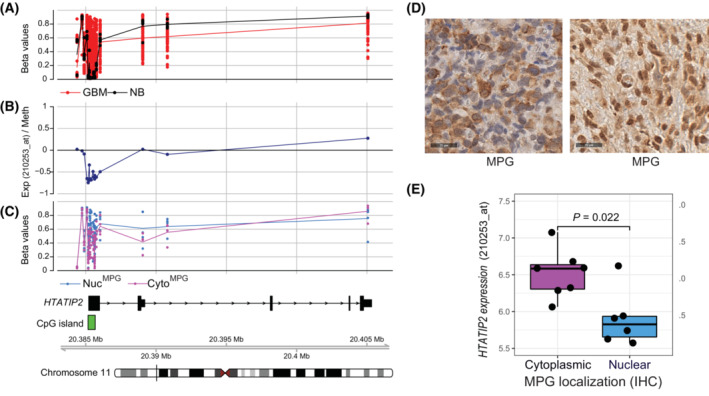
Fig. 1.

Association of HTATIP2 methylation and expression with subcellular localization of MPG. (A) The β‐values of CpG methylation in the promoter of HTATIP2 is visualized for our cohort of GBM (n = 63, red) and nontumoral brain (NTB, n = 5, black) based on 450k data (chromosomal location of probes as indicated in the track at the bottom: Mb, megabase). Highly variable methylation is observed in the CpG island (indicated in green beneath panel C) associated with the HTATIP2 promoter in GBM, while no methylation is detected in NTB. (B) The functional methylation of the HTATIP2 promoter is indicated by a negative correlation (Spearman) between HTATIP2 expression (Affymetrix probe 210253_at, recognizes all transcripts) and DNA methylation (Exp/Meth) (black). (C) Illustration of CpG methylation of HTATIP2 (β‐values), stratified by subcellular localization of MPG, nuclear (Nuc, blue), or cytoplasmic (Cyto, pink), of the corresponding tumor tissues as classified by immunohistochemistry (IHC; TMA). (D) MPG expression (IHC, antibody against MPG) in two representative GBM of the cohort displaying either predominantly cytoplasmic (left panel) or nuclear (right panel) MPG, respectively (size bar 25 μm). (E) HTATIP2 expression (Affymetrix probe 210253_at) was significantly different between GBM samples with cytoplasmic (Cyto, pink) or nuclear MPG (Nuc, blue) (P = 0.022, Wilcoxon test), respectively, as determined by IHC of the corresponding samples on the TMA. Cytoplasmic MPG was associated with higher HTATIP2 expression. Illustrated by boxplot representation, where the rectangle, horizontal dark line, and vertical dark line correspond to the interquartile range (IQR), median, and the distance between minimal and maximal values, respectively. The observations (black points) are superimposed on the boxplot representation. GBM with both, nuclear and cytoplasmic expression were not included in the analyses shown in C and E.
