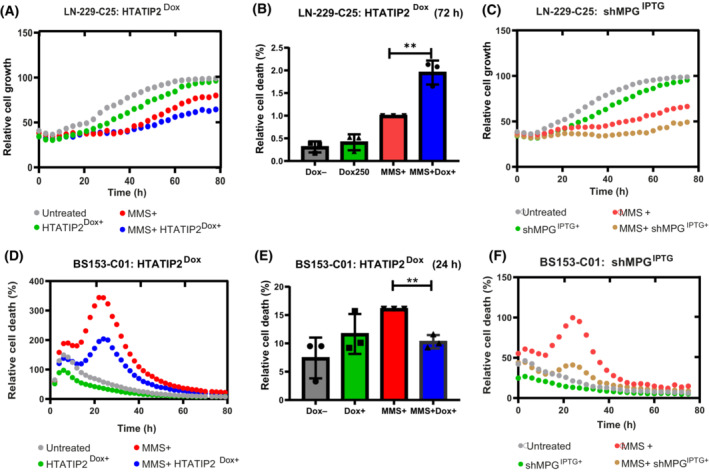
Fig. 6.

HTATIP2 modulates cell response to MMS treatment. (A) LN‐229‐C25‐HTATIP2Dox cells were treated with Dox for 48 h to induce HTATIP2 expression followed by treatment with methylmethansulfonate (MMS). Relative cell growth was determined by monitoring cell confluency over 72 h by phase contrast, taking images every 3 h (IncuCyte, representative experiment). Treatment conditions, untreated (gray), Dox (250 ng·mL−1) (green), MMS (200 nm) (red), and the combination (blue). (B) Cell death at 72 h in response to MMS was detected by Annexin V/APC apoptosis detection kit (**P < 0.01, t‐test, based on three biological replicates, mean normalized to MMS+, ±SD). (C) The shMPG was induced in LN‐229‐C25 shMPGIPTG followed by MMS treatment and the relative growth was determined as in (A) (untreated, gray; IPTG [62.5 ng·mL−1], green; MMS [200 nm], red; combination, yellow). (D) Relative cell death (Cytotox, red channel IncuCyte, representative experiment) in response to MMS treatment was monitored in BS153‐C01‐HTATIP2Dox over 72 h using the same treatment scheme as in (A) and inducing HTATIP2 with Dox (500 ng·L−1). (E) The relative cell death at 24 h was determined with Annexin V/PAC and quantified as in (B) (**P < 0.01, t‐test, based on three biological replicates, mean normalized to MMS+, ±SD). (F) Relative cell death in response to MMS was monitored in BS‐153‐C01‐shMPGIPTG as in (D) (Cytotox, red channel IncuCyte) over 72 h upon depletion of MPG (untreated, gray; IPTG [125 ng·mL−1], green; MMS [200 nm], red; combination, yellow).
