
Fig. 3.
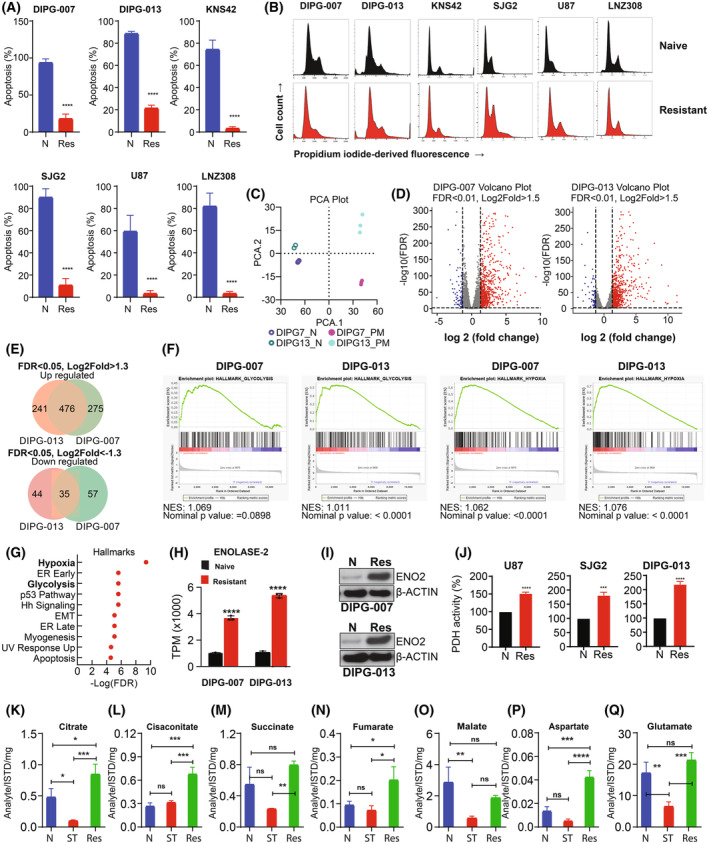
Resistance is associated with an enhanced glycolytic phenotype. (A) Drug‐naïve (N) or PM‐resistant (Res) cells were treated with the combination of panobinostat and marizomib (25 nm each) for 48 h. After harvesting, cells were labeled with annexin V and propidium iodide, and cell viability was assessed by flow cytometry. The results represent the mean of three independent experiments. Error bars indicate ± SD (****P < 0.0001; naive‐treated vs. resistant cells; unpaired two‐tailed t‐test). (B) Drug‐naïve (upper panel) or PM‐resistant cells (lower panel) were allowed to attach overnight in a 6‐well plate. Cells were harvested and stained with propidium iodide (PI). Cell cycle profile was assessed by flow cytometry. Representative images acquired from three independent experiments for each cell type are shown. (C) Principal component analysis (PCA) plot of RNA‐seq data comparing drug‐naïve control DIPG‐0007 and DIPG‐013 with PM‐resistant cell lines (n = 3). (D) Volcano plot of differential gene expression (FDR, false discovery rate) analysis of RNA‐seq data comparing drug‐naïve vs. PM‐resistant DIPG‐007 (left panel) and DIPG‐013 (right panel) cell lines (n = 3). The number of upregulated genes that are highlighted in red FDR < 0.01, Log2fold > 1.5, and downregulated genes that are highlighted in Blue FDR < 0.01, Log2fold < −1.5 (n = 3). (E) Venn‐diagram showing the number of upregulated genes (upper panel) and downregulated (lower panel) genes (n = 3). (F) Gene set enrichment analysis (GSEA) plots (NES, normalized enrichment score) showing glycolysis and hypoxia gene sets of DIPG‐007 and DIPG‐013 of drug‐naïve vs. PM‐resistant cell lines (n = 3). (G) Hallmark analysis of drug‐naïve vs. PM‐resistant DIPG‐013 cell lines reveals enrichment of hypoxia and glycolytic signatures (among top 10; n = 3). (H) Transcripts per million (TPM) of enolase‐2 in DIPG‐007‐ and DIPG‐013‐naïve vs. ‐resistant cell lines, the results were generated from three biological replicates (****P < 0.0001 naïve vs. resistant, analysis was performed as one‐way ANOVA). Data are displayed as mean with standard deviation. (I) Drug‐naïve (N) or PM‐resistant cells (Res) were allowed to attach overnight in a 6‐well plate. Whole cell lysates were prepared, and western blot analysis was performed with the indicated antibodies (ENO2, enolase‐2). Representative blots acquired from three independent experiments for each cell type are shown. (J) Drug‐naïve (N) and PM‐resistant (Res) U87, SJG2, and DIPG‐013 cells were seeded in 6‐well plates. On the following day, cellular pyruvate dehydrogenase (PDH) activity was assessed as described in the Section 2. The results represent the mean ± SD of three independent experiments (***P < 0.0005; ****P < 0.0001; unpaired two‐tailed t‐test). (K–Q) Quantification of TCA cycle‐related metabolites from U87‐resistant cells and drug‐naïve cells treated with the combination of panobinostat and marizomib for 72 h (ST, short‐term). Untreated control cells (N) received vehicle (DMSO). Citrate (K), cis‐aconitate (L), succinate (M), fumarate (N), malate (O), aspartate (P) and glutamine (Q). The values are represented as mean ± standard deviation of three separate experiments (K–Q). Statistical significance was assessed with Tukey's ANOVA (ns, nonsignificant, *P < 0.05, **P < 0.005, ***P < 0.0005, and ****P < 0.0001).