Fig. 5.

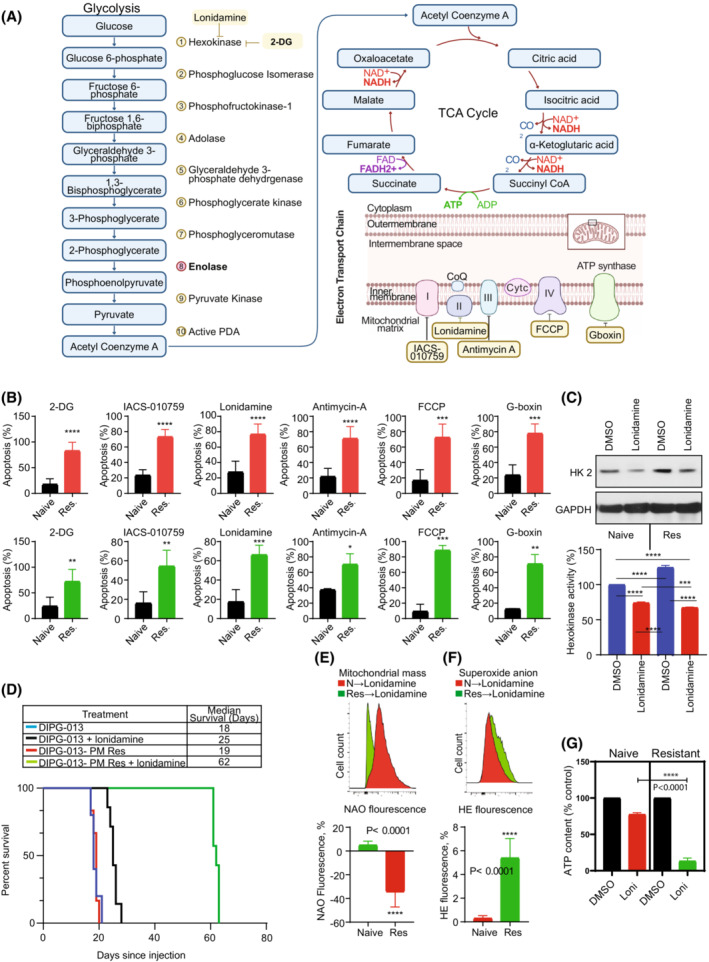
Targeting mitochondrial energetics overcomes panobinostat and marizomib‐induced drug resistance in glioma. (A) Graphical representation of therapeutic agents for targeting glycolysis and OXPHOS. Figure created using BioRender.com. (B) Drug‐naïve (Naïve) or PM‐resistant cells (Res) were seeded in 6‐well plates at the density of 1.5 × 10⁵ per well in 3 mL of media (DIPG‐013 upper panel; U87, lower panel). On the following day, cells were treated with either 2‐DG (10 mm), IACS‐010759 (10 μm), lonidamine (200 μm), antimycin A (10 μm), FCCP (25 μm) or Gboxin (10 μm), inhibitors of glycolysis or different component of the electron transport chain (ETC). After 3 days of incubation, apoptosis was analyzed by Annexin assay using flow cytometry. The results represent the mean of three independent experiments. Error bars indicate ± SD (unpaired two‐tailed t‐test; *P < 0.01, **P < 0.005; ***P < 0.0005; ****P < 0.0001). (C) Drug‐naïve (Naïve) or PM‐resistant (Res) DIPG‐013 cells were treated with lonidamine (100 μm) for 72 h. Control cells received vehicle (DMSO). Cell extracts were prepared using hexokinase assay buffer (provided in the hexokinase enzyme activity assay kit as described in the Section 2). Twenty micrograms of protein were loaded on a sodium dodecyl sulfate‐polyacrylamide gel and probed with the indicated antibodies by western blotting. Fifty micrograms of protein were used to measure hexokinase enzyme activity. These experiments were performed three times, and a representative blot (upper panel) and the change in hexokinase enzyme activity relative to drug‐naïve control are presented in the lower panel. Data represent the mean ± SD from three independent experiments. Statistical significance was assessed with Tukey's ANOVA (***P < 0.0005, ****P < 0.0001). (D) Kaplan–Meier analysis of in vivo models of drug‐naïve or PM‐resistant DIPG‐013 tumors treated with either vehicle control or lonidamine. DIPG‐013‐naïve models treated with vehicle control (n = 5) had a median survival of 18 days, while DIPG‐013‐naïve cells treated with lonidamine (n = 7) showed a significantly increased median survival of 25 days (P = 0.0003). PM‐resistant DIPG‐013 models (n = 6) showed a median survival of 19 days, while the lonidamine‐treated group (n = 7) showed a significant increase in median survival of 62 days (P = 0.0003). No difference in survival was noted between DIPG‐013‐naïve vs. ‐resistant cells. (E–G) Drug‐naïve (N) or PM‐resistant (Res) DIPG‐013 cells were allowed to attach overnight in a 6‐well plate. On the following day, cells were treated with lonidamine (100 μm). Mitochondrial mass (E) and superoxide anion (F) content was measured by flow cytometric analysis. The representative FACS histogram is shown in the upper panel. Bar graph (bottom panel) represents the mean of three independent experiments ± standard deviation (E, F, unpaired two‐tailed t‐test; ****P < 0.0001). (G) Cellular ATP content was assessed as described in the Section 2. Data represent the mean ± SD from three independent experiments. Statistical significance was assessed with Tukey's ANOVA (****P < 0.0001). mean ± SD.
