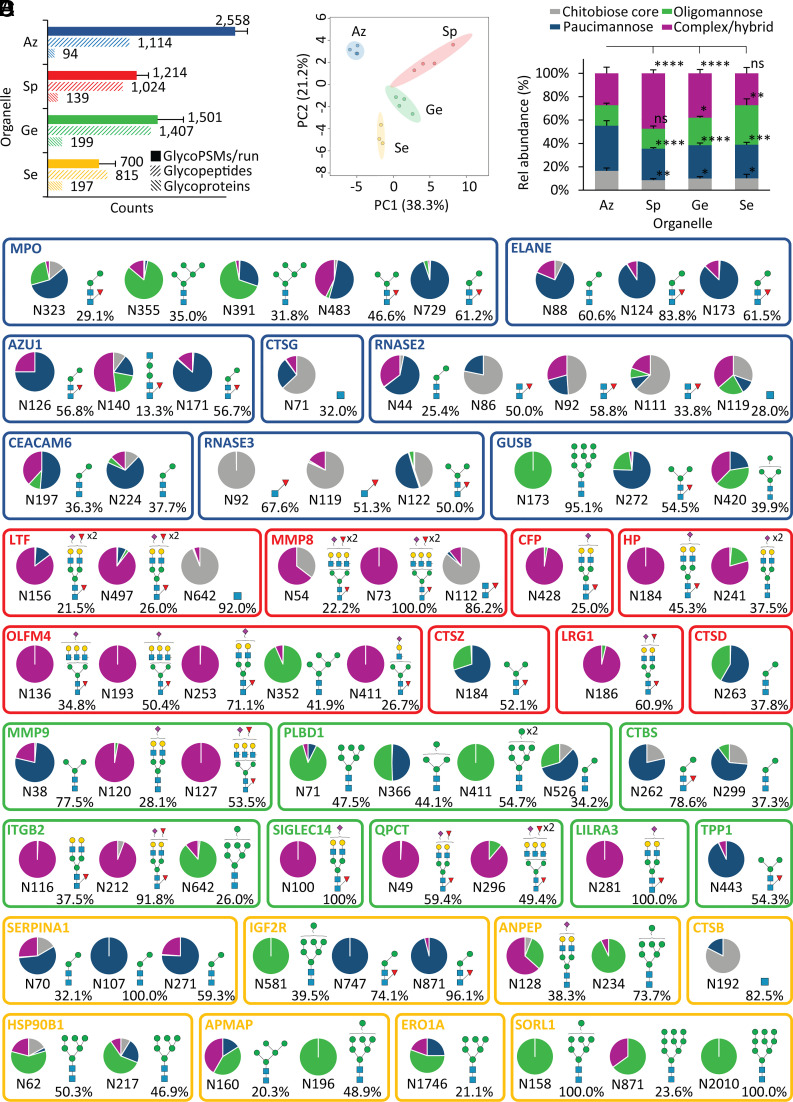
Fig. 3.
Glycoproteomics reveals site-, protein-, and organelle-specific N-glycosylation across the neutrophil compartments. (A) Glycoproteome coverage across the neutrophil compartments as measured by N-glycoPSM counts, unique N-glycopeptides (unique protein, site, glycan), and source N-glycoproteins identified by quantitative glycoproteomics. GlycoPSM data are plotted as mean ± SD, while glycopeptide/glycoprotein data are plotted as total counts from four biological replicates (n = 4). (B) Glycoproteomics-informed PCA of the neutrophil compartments (Az, Sp, Ge, and Se). (C) N-glycan type distribution across the neutrophil compartments based on glycoPSM spectral counting. Data plotted as mean ± SD (n = 4 biological replicates, *P < 0.05, **P < 0.01, ****P < 0.0001, ns, not significant, ANOVA test). (D) Extensive N-glycan diversity across sites and proteins as illustrated for the eight most abundant N-glycoproteins (out of 100 to 200 glycoproteins/granule) across each neutrophil compartment. The quantification of the site-specific glycoform distribution was performed by dividing the area-under-the-curve (AUC) of each glycoform by the summed AUC of all glycoforms identified within the same site from the same glycoprotein. The most abundant glycoform (and its relative abundance) is indicated for each site. An additional N-glycosylation site (N139), not part of the mature polypeptide chain, was observed for MPO, but left out of the map due to a low abundance (< 5%) relative to the other sites. See Fig. 1 for key.

