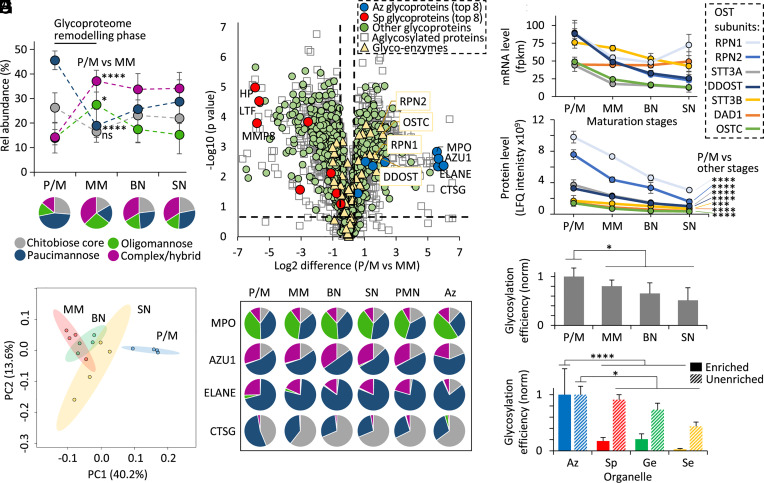
Fig. 4.
Dramatic glycoproteome remodeling in early granulopoiesis is accompanied by changes in proteome expression and the glycosylation initiation machinery. (A) N-glycan class distribution during granulopoiesis as established by glycopeptide profiling from proteomics of key myeloid progenitor cell types (P/M, MM, BN, SN) (25). For this analysis, glycoPSM-based quantitation was performed using an approach involving subtraction of glycoproteins identified in the maturation stage(s) prior to the specific maturation stage being assessed (hence considering only newly expressed glycoproteins at each stage). (B) N-glycopeptide-informed PCA of the four populations of myeloid progenitors. (C) Differential transcript expression between P/M and MM progenitors. Permutation-based FDRs < 0.05 and S0 > 0.1 were calculated using Perseus. Dashed x/y lines represent significance thresholds. Proteins were assigned with organelle location/glycosylation status based on glycoproteomics data (Dataset S5). Key N-glycosylation enzymes (yellow) including OST subunits (boxed, yellow) and the eight most abundant Az (blue) and Sp (red) granule glycoproteins among other glycosylated (green) and nonglycosylated (white) granule proteins are highlighted. (D) Uniform N-glycosylation of key Az granule glycoproteins during granulopoiesis, in blood neutrophils (PMN) and in their principal compartment (“Az”) of resting neutrophils. For simplicity, multiple sites were combined for the glycoprofile of MPO, AZU1, and ELANE. (E) Transcript (mRNA) and (F) protein expression profile of the OST subunits during myeloid differentiation. Data plotted as mean ± SD (n = 4 biological replicates, ***P < 0.001, ****P < 0.0001, Student’s t tests, P/M vs. other maturation stages combined). Global protein N-glycosylation efficiency (G) during granulopoiesis and (H) across the corresponding neutrophil compartments mapped and compared separately for enriched (full bars) and unenriched (broken bars) glycoproteomics data. Data plotted as mean ± SD and normalized against P/M stage or Az granule (n = 4 biological replicates. *P < 0.05, ****P < 0.0001, Student’s t tests, P/M or Az vs. other maturation stages or other compartments combined). See Fig. 1 for key.

