Fig. 1.
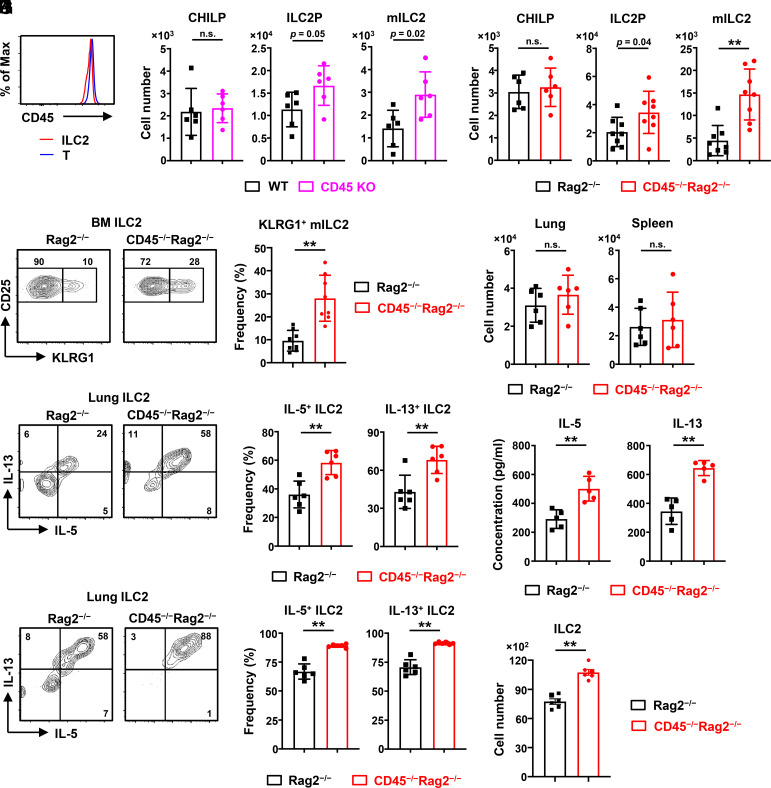
CD45 restrains expansion, maturation, and cytokine production of ILC2s. ILC2s isolated from CD45 knockout (KO) and wild-type mice (WT) (A and B) or CD45−/−Rag2−/− and control Rag2−/− mice (C–K) were analyzed by flow cytometry. (A) Expression of CD45 on ILC2s (Lin−IL-7R+Sca-1+CD25+ST2+) and T cells in the bone marrow of WT mice. (B) Numbers of common helper-like ILC progenitors (CHILPs) (Lin−IL-7R+CD25−ST2−α4β7+Flt3−), ILC2 precursors (ILC2Ps) (Lin−IL-7R+Sca-1+CD25+ST2+KLRG1−), and mature ILC2s (mILC2s) (Lin−IL-7R+Sca-1+CD25+ST2+KLRG1+) in the bone marrow of CD45 KO and WT mice (n = 6). (C) Numbers of CHILPs, ILC2Ps, and mILC2s in the bone marrow of CD45−/−Rag2−/− and control mice (n = 6 to 8). (D) Flow cytometric analysis and frequency of mILC2s in the bone marrow (n = 8). (E) Numbers of ILC2s (Lin−IL-7R+CD25+ST2+KLRG1+) in the lung and spleen (n = 6). (F and G) Flow cytometric analysis (F) and frequency (G) of IL-5+ and IL-13+ lung ILC2s after stimulation with PMA and ionomycin for 4 h (n = 6). (H and I) Freshly isolated ILC2s were seeded at 4,000 cells/well in a round bottom 96-well plate and cultured with 10 ng/mL IL-2 and 1 ng/mL IL-33. Flow cytometric analysis (H) and frequency (I) of IL-5+ and IL-13+ ILC2s after ex vivo culture with IL-2 and IL-33 for 3 d (n = 6). (J and K) The IL-5 and IL-13 concentrations in the culture supernatants detected by enzyme-linked immunosorbent assay (ELISA) (J) and the cell number of ILC2s per well (K) after ex vivo culture for 3 d, as shown in H and I (n = 5 to 6). Data represent at least two independent experiments with similar results (A, D, F, and H). Data are mean ± SD with Student’s t test and pooled from two to four independent experiments (B–E, G, and I–K). **P < 0.01; n.s., not significant.

