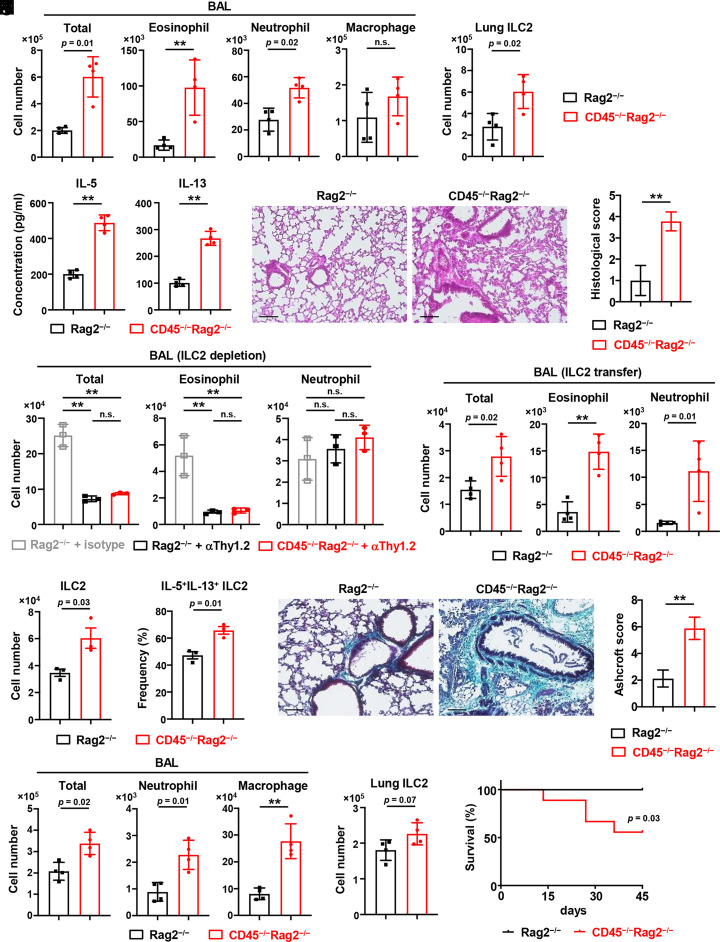
Fig. 5.
CD45 limits lung inflammation and fibrosis via ILC2s. (A and B) CD45−/−Rag2−/− and control Rag2−/− mice were intranasally administrated with 50 µg papain daily for 3 consecutive days to induce airway inflammation. Numbers of total cells, eosinophils, neutrophils, and macrophages in BAL fluid (A) and ILC2s in the lung (B) (n = 4). (C) The IL-5 and IL-13 concentrations were detected by ELISA in the BAL fluid from mice, as shown in A and B (n = 4). (D and E) H&E staining (D) and histological scores (E) of the lung from mice, as shown in A and B (n = 4). (Scale bar, 100 µm.) (F) Lung ILC2s in CD45−/−Rag2−/− and Rag2−/− mice were depleted by administration with anti-mouse Thy-1.2 (30H12) antibody or control Rag2−/− mice were treated with rat IgG2b isotype control at 2 and 4 d before exposure to papain. After intranasally administrated with papain for 3 consecutive days, total cells, eosinophils, and neutrophils in BAL fluid were measured (n = 3). (G and H) IL-7Rα KO mice were adoptively transferred with lung ILC2s sorted from CD45−/−Rag2−/− or Rag2−/− mice and then intranasally administrated with papain for 3 consecutive days. Numbers of ILC2s (G) and frequency of IL-5+IL-13+ ILC2s (H) in the lung of IL-7Rα KO recipient mice (n = 3). (I) The number of total cells, eosinophils, and neutrophils in the BAL fluid of IL-7Rα KO recipient mice, as shown in G and H (n = 4). (J and K) CD45−/−Rag2−/− and control Rag2−/− mice were intraperitoneally administrated with 4 mg/kg bleomycin to induce lung fibrosis. Masson’s trichrome staining of lung sections (J) and Ashcroft scoring of lung fibrosis (K) were performed on day 7 (n = 3). (Scale bar, 100 µm.) (L and M) Numbers of total cells, neutrophils, and macrophages in the BAL fluid (L) and ILC2s in the lung (M) from mice, as shown in J and K (n = 4). (N) The survival rate of CD45−/−Rag2−/− and Rag2−/− mice treated with bleomycin for 45 d. Each group consisted of eight mice, and the log-rank test evaluated the difference. Data are mean ± SD with Student’s t test (A–C, E, I–H, and K–M) or one-way ANOVA (F) and pooled from two to three independent experiments. Data represent two independent experiments with similar results (D, J, and N). **P < 0.01. n.s., not significant.

