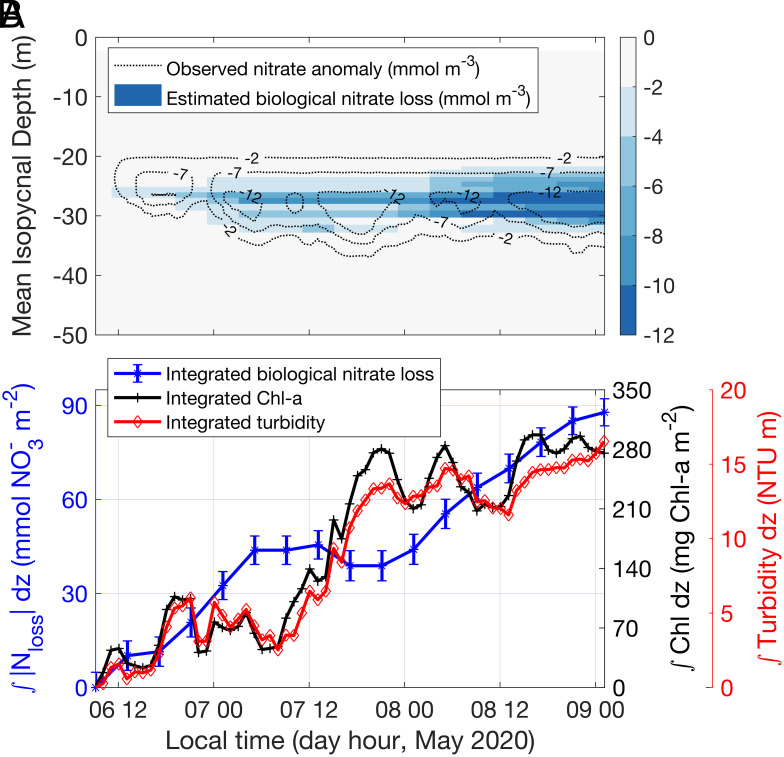
Fig. 4.
Variability in nitrate concentration at depth due to dinoflagellate migrations. (A) Estimated biologically induced nitrate loss (color) and observed nitrate anomaly (contours) referenced to the first profile during this period. (B) Time series of depth-integrated (0 to 33 m) absolute biologically induced nitrate loss (blue line with star markers), Chl-a concentrations (black line with plus markers), and turbidity (red line with diamond markers). Error bars represent error estimations following the error propagation procedures (SI Appendix).

