Fig. 5.
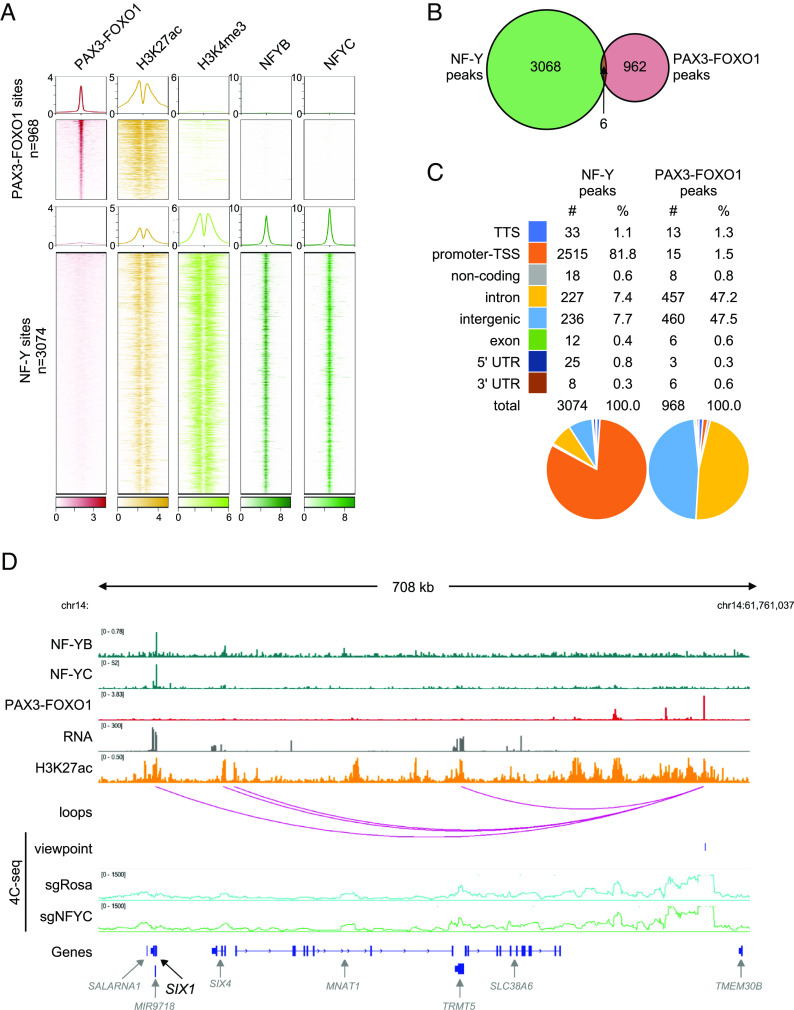
Genome-wide analysis of chromatin association of NF-Y and PAX3–FOXO1. (A) Heatmaps and profiles visualizing enrichment of PAX3–FOXO1, H3K27ac (active enhancer mark), H3K4me3 (active promoter mark), and NF-Y (NF-YB and NF-YC subunits) in RH4 PAX3–FOXO1+ RMS cells. Elements are categorized into two classes: PAX3–FOXO1 bound (n = 968) and NF-Y bound (n = 3,074). The rows depict 4-kb regions, centered on PAX3–FOXO1 or NF-Y peaks and ranked by the respective signal intensities. For PAX3–FOXO1, H3K27ac and H3K4me3, color shading corresponds to chromatin immunoprecipitation followed by sequencing (ChIP-seq) read counts; for NF-YB and NF-YC, color shading corresponds to CUT&RUN read counts. (B) Venn diagram depicting an overlap between NF-Y peaks and PAX3–FOXO1 peaks. (C) Classification and quantification of genomic elements bound by NF-Y and PAX3–FOXO1. (D) View of the SIX1 locus, representing NF-Y binding at the promoter, PAX3–FOXO1 binding at a distal enhancer, and interaction of the two sites on chromatin loops in 3D. H3K27ac marks and RNA expression of genes within the region is indicated. Bottom: 4C-seq validation of the 3D interaction between NF-Y bound promoter and PAX3–FOXO1 bound distal enhancer in sgRosa and sgNFYC cells analyzed 7 d post lentiviral transduction. Viewpoint is indicated. Plotted 4C-seq signal represents an average of two biological replicates.

