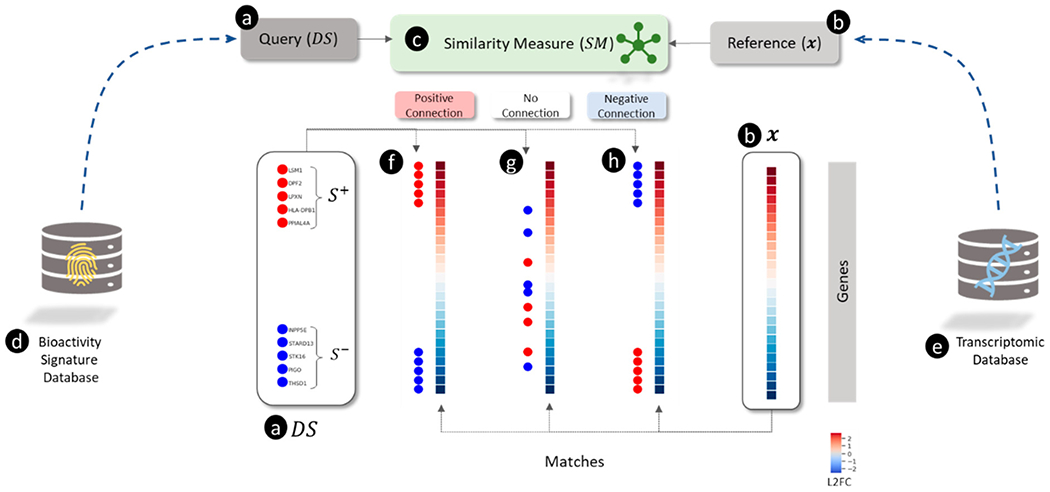
Figure 1.

Overview of connectivity mapping as a pattern matching between (a) query and (b) reference using a (c) similarity measure illustrating different types of matches (f, g, and h). (a) The query is a directional gene signature () signified by a set of up-regulated genes ( shown as red circles) and a set of down-regulated genes ( shown as blue circles). (b) The reference is a transcriptomic profile shown as a vector of log2 transformed fold-change (L2FC) values for each gene (blue and red colors represent down- and up-regulation, respectively). (c) The similarity measure () for scoring the match between and . (d) A collection of predefined signatures representing sets of genes (e.g., involved in pathways). (e) A collection of transcriptomic profiles for a set of perturbagens. (f) “Positive connection” between and when and are correlated with up- and down-regulated genes in . A positive connection is a match found when . (g) “No connection” between and when and are uncorrelated with up- and down-regulated genes in (where . (h) “Negative connection” between and when and are anti-correlated with up- and down-regulated genes in . A negative connection is a match found when .
