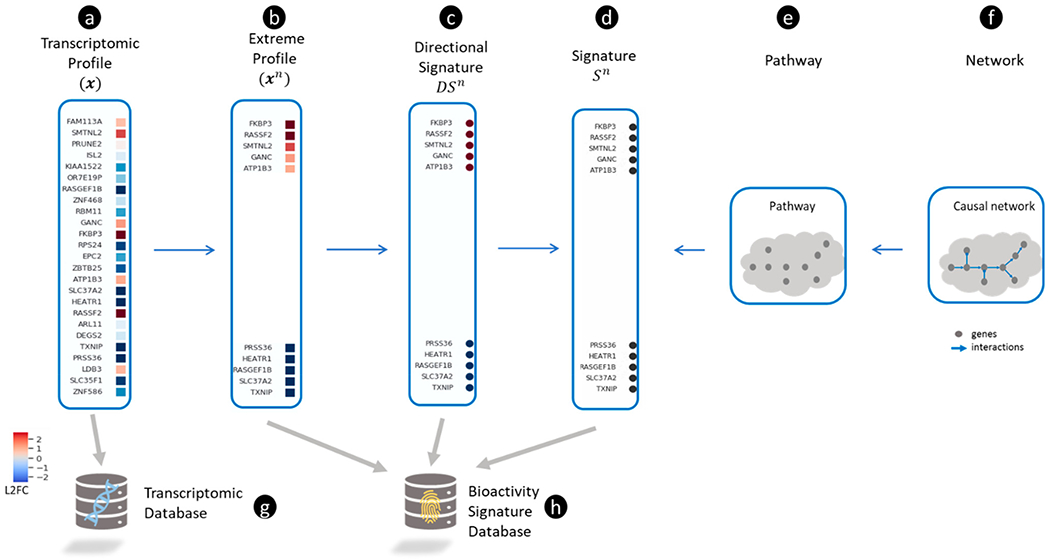
Figure 2.

Representing transcriptomic profiles and gene signatures. (a) A transcriptomic profile shown as a vector of log2 transformed fold-change (L2FC) values for each gene (blue and red colors represent down- and up-regulation, respectively). (b) An extreme transcriptomic profile is defined by selecting the most up- and down-regulated genes in (shown as red and blue squares, respectively). (c) A directional signature () is defined by transforming all up- and down-regulated genes in to 1 and −1, respectively. The directional signature (), is signified by a set of up-regulated genes ( shown as red circles) and a set of down-regulated genes ( shown as blue circles). (d) A non-directional signature () is derived from by ignoring the direction of expression changes for all genes (all genes are shown as black circles). (e) A pathway containing a collection of proteins can be represented by a set of genes (which encode the proteins) and defined as a non-directional signature (). (f) A causal network comprised of interacting proteins can be represented simply by a collection of genes (which can be represented as . (g) A transcriptomic database is a collection of . (h) A bioactivity signature database is a collection formed by one or more of the following types of signatures: , and .
