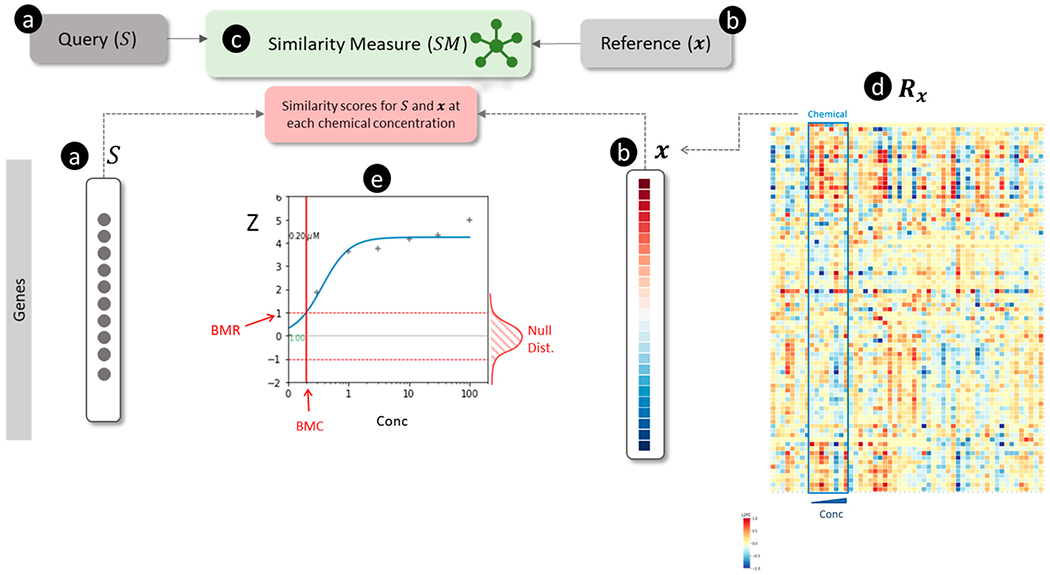
Figure 4.

Overview of connectivity mapping for estimating chemical concentration-dependent scores for a signature. (a) The query is a non-directional gene signature () signified by a set of genes (shown as black circles). (b) The reference is a transcriptomic profile shown as a vector of log2 transformed fold-change (L2FC) values for each gene (blue and red colors represent down- and up-regulation, respectively). (c) The similarity measure () for scoring the match between and . (d) A transcriptomic database () comprised of a collection of for multiple chemicals and concentrations (Conc). is visualized as a matrix in which the rows represent genes, the columns show chemical concentrations, and the values in each column are . For example, the outlined box in the matrix signifies eight for each of the concentrations of a chemical. (e) Concentration-response analysis of similarity scores between and ) for each of chemical shown in (d). The ordinate and abscissa show the similarity scores and the concentrations of the chemical, respectively. A null distribution (Null Dist.) of similarity scores (shown on the right of the graph along the ordinate axis) is generated by permuting and calculating for all random profiles. The standardized similarity scores (Z) (calculated using the null distribution and shown as “+” symbols) are analyzed by curve-fitting. The fitted concentration-response curve (blue) is used to estimate the benchmark concentration (BMC) corresponding to the benchmark response (BMR) value of Z=1.
